You are using an out of date browser. It may not display this or other websites correctly.
You should upgrade or use an alternative browser.
You should upgrade or use an alternative browser.
Monitoring [former Advanced Monitoring] extension in Plesk
- Thread starter AYamshanov
- Start date
I enabled the allowSuperAdmin in /usr/local/psa/admin/conf/panel.ini, and can now add a graph. However the monitoring__rrd-server datasource from Plesk does not provide a disk-io-wait or time-per-op metric. Any idea how to add another metric to the Plesk monitoring backend?
hm... Could you please describe a server environment? What OS are you using? Is it a dedicated server/VPS or some kind of para-virtualized server? Is there a dedicated hard disk? It looks like "sw-collectd" couldn't collect info about performance metrics.
Could you please execute "cat /proc/diskstats" like this:
Some details about fields in the output:
- https://www.kernel.org/doc/Documentation/ABI/testing/procfs-diskstats
- https://www.kernel.org/doc/Documentation/iostats.txt
I think Virtuozzo does not provide such data to the virtualized host and that is a reason why it is not collected by (sw-)collectd.
Code:
# cat /proc/diskstats
   7       0 loop0 214775 0 431590 152720 0 0 0 0 0 5356 145464
   7       1 loop1 393386 0 790842 62024 0 0 0 0 0 2452 56436
   7       2 loop2 239 0 568 240 0 0 0 0 0 0 0
   7       3 loop3 541622 0 1085320 79764 0 0 0 0 0 3536 71536
   7       4 loop4 6 0 18 0 0 0 0 0 0 0 0
   7       5 loop5 0 0 0 0 0 0 0 0 0 0 0
   7       6 loop6 0 0 0 0 0 0 0 0 0 0 0
   7       7 loop7 0 0 0 0 0 0 0 0 0 0 0
 202       0 xvda 41699694 65372408 1352366604 157501900 61041547 10336075 892965888 748377704 0 21656128 905845372
 202       1 xvda1 41698265 65372408 1352317588 157500932 61041444 10336075 892965064 748377652 0 21655600 905842684

#
Some details about fields in the output:
- https://www.kernel.org/doc/Documentation/ABI/testing/procfs-diskstats
- https://www.kernel.org/doc/Documentation/iostats.txt
I think Virtuozzo does not provide such data to the virtualized host and that is a reason why it is not collected by (sw-)collectd.
Advanced Monitoring says "Dashboard not found".
The grafana Integration for "monitoring" fails.
In grafana.log i see this when i click to "restart integration" inside grafana:
Plesk Obsidian Version 18.0.27 Update #1
Advanced Monitoring Version: 1.3.0-172
Grafana Version: 1.1.5-163
grafana is running and listening
I already tried this - didnt helped.
Any ideas? Many thanks in advance
The grafana Integration for "monitoring" fails.
In grafana.log i see this when i click to "restart integration" inside grafana:
Code:
lvl=eror msg="Invalid username or password" logger=context error="Too many consecutive incorrect login attempts for user. Login for user temporarily blocked"Plesk Obsidian Version 18.0.27 Update #1
Advanced Monitoring Version: 1.3.0-172
Grafana Version: 1.1.5-163
grafana is running and listening
Code:
netstat -tanpl | grep 3030
tcp        0      0 127.0.0.1:3030          0.0.0.0:*               LISTEN      31831/grafana-serve
I already tried this - didnt helped.
Any ideas? Many thanks in advance
jradzuweit
Basic Pleskian
Hi, I have the same problem. I removed and reinstalled both the extended monitoring and grafana, but always the same result.
OS : Ubuntu 16.04.6 LTS
Product: Plesk Obsidian
Version 18.0.27 Update #1, last updated on May 26, 2020 06:27 AM
Advanced Monitoring Version : 1.3.0-172
Grafana : Version 1.1.5-163
On Home->Extension->Grafana it says that the integration failed and if I restart the integration it says something went wrong look in the logfile (see attached file)
Attachments
Hi,
Had you updated Grafana to 7.0.x before the issue happened?
I have checked the log and see the exact five incorrect attempts ("Invalid Username or Password") after and then "Too many consecutive incorrect login attempts for user. Login for user temporarily blocked". It looks like start working brute_force_login_protection.
Currently, I am not sure but could you please check/remove session cookies (see Forwarded to devs - Advanced monitoring stopped working after Grafana 7.0.0 update. Ubuntu/Centos), wait 7-10 minutes and try open Advanced Monitoring again? Maybe outdated cookies caused the "invalid username or password" error and started the protection.
As another option, you could try to disable brute_force_login_protection and check again (Configuration) but it better to do only as a test.
jradzuweit
Basic Pleskian
nope I have the error a while,
Removed everything but still the same "Dashboard not found" in the log file disappeared the "Invalid username/password" entry
I disabled the bruteforce thing but still the same
Removed everything but still the same "Dashboard not found" in the log file disappeared the "Invalid username/password" entry
I disabled the bruteforce thing but still the same
Last edited:
Clearing cookies did not worked.
Disabling brute_force_login_protection did not worked.
Still "Dashboard not found" message in Advanced Monitoring
And still "lvl=eror msg="Invalid username or password" logger=context error="Invalid Username or Password"" in grafana.log when trying to restart integration in grafana.
More ideas?
Disabling brute_force_login_protection did not worked.
Still "Dashboard not found" message in Advanced Monitoring
And still "lvl=eror msg="Invalid username or password" logger=context error="Invalid Username or Password"" in grafana.log when trying to restart integration in grafana.
More ideas?
Hi @AYamshanov - thanks for the great extension! One question: I tried to install Percona's genius Monitoring PMM2 (Download Percona Monitoring and Management 2) in parallel, but I didn't manage to get any numbers from the server that has Plesk installed. All other servers went fine with it out of the box. Is it possible that there is some kind of interference between Advanced Monitoring and PMM2?
Thank you!
Thank you!
Could you please execute "cat /proc/diskstats" like this:
Code:# cat /proc/diskstats 7 0 loop0 214775 0 431590 152720 0 0 0 0 0 5356 145464 7 1 loop1 393386 0 790842 62024 0 0 0 0 0 2452 56436 7 2 loop2 239 0 568 240 0 0 0 0 0 0 0 7 3 loop3 541622 0 1085320 79764 0 0 0 0 0 3536 71536 7 4 loop4 6 0 18 0 0 0 0 0 0 0 0 7 5 loop5 0 0 0 0 0 0 0 0 0 0 0 7 6 loop6 0 0 0 0 0 0 0 0 0 0 0 7 7 loop7 0 0 0 0 0 0 0 0 0 0 0 202 0 xvda 41699694 65372408 1352366604 157501900 61041547 10336075 892965888 748377704 0 21656128 905845372 202 1 xvda1 41698265 65372408 1352317588 157500932 61041444 10336075 892965064 748377652 0 21655600 905842684 #
Some details about fields in the output:
- https://www.kernel.org/doc/Documentation/ABI/testing/procfs-diskstats
- https://www.kernel.org/doc/Documentation/iostats.txt
I think Virtuozzo does not provide such data to the virtualized host and that is a reason why it is not collected by (sw-)collectd.
Hello @AYamshanov , @jpveen
i have also a virtual server from strato and would like to monitor disk performance. CentOS Linux 7.8.2003 (Core) Plesk Obsidian 18.0.30 Update 2. Is there a way to monitor the io performance?
Thanks a Lot!
Last edited:
Hi sall10,
There is the same answer:
There is the same answer:
If the system does not provide such metrics per storage, it could not be shown in Advanced Monitoring because there are no source data for these graphs.Could you please execute "cat /proc/diskstats"? [...]
I think Virtuozzo does not provide such data to the virtualized host and that is a reason why it is not collected by (sw-)collectd.
Hi peterbo,Hi @AYamshanov - thanks for the great extension! One question: I tried to install Percona's genius Monitoring PMM2 (Download Percona Monitoring and Management 2) in parallel, but I didn't manage to get any numbers from the server that has Plesk installed. All other servers went fine with it out of the box. Is it possible that there is some kind of interference between Advanced Monitoring and PMM2?
Thank you!
No, I sure at 99% percent that Advanced Monitoring could not be a reason why PPM2 could not get any numbers/metrics from a database on a server with Plesk.
There are could be many different things like network configuration (e.g.: firewall, network address translation (NAT), and so on).
(c) Installing ClientsPMM Client is a package of agents and exporters installed on a database host that you want to monitor. Before installing the PMM Client package on each database host that you intend to monitor, make sure that your PMM Server host is accessible.
For example, you can run the ping command passing the IP address of the computer that PMM Server is running on.
Hi sall10,
There is the same answer:
If the system does not provide such metrics per storage, it could not be shown in Advanced Monitoring because there are no source data for these graphs.
Hello AYamshanov,
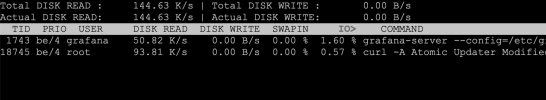
thanks for the Reply. When I execute the command cat /proc/diskstats I get file or directory not found... When I check under /proc I get this:
1 1184 1398 1418 1457 1580 169 1732 1780 18053 18071 18402 3192 414 8946 cpuinfo kmsg net sysrq-trigger vz
1017 120 1402 1424 1458 1599 1723 1736 1781 18054 18072 18411 400 427 967 devices loadavg partitions sysvipc
1018 132 1403 1428 1461 16412 1724 1737 18045 18063 18083 18460 401 5364 982 fairsched locks self uptime
1019 133 1404 1454 1542 166 1727 1738 18047 18064 18085 18469 405 72 99 fairsched2 meminfo stat user_beancounters
1083 134 1405 1455 1578 1679 1730 1773 18051 18069 1819 2 406 851 cgroups filesystems modules swaps version
118 1358 1406 1456 1579 1683 1731 1779 18052 18070 18305 3 408 8945 cmdline fs mounts sys vmstat
Im just wondering, as I get the disk read and write information with iotop command is there not a way to somehow get this information in the monitoring ???
Thx
Attachments
I see. Advanced Monitoring shows information about storage performance and gets metrics from the kernel for a device (read/write, time/op, IOPS). Virtuozzo does not provide such devices into a virtualized host, that is why this source of data is not available in the extension.
`iotop` gets metrics from the kernel too but it is metrics for processes (not hardware devices). It seems "Repair Kit" extension shows the same metrics ("Tools & Settings / Assistance and Troubleshooting / Process list") but it does not save any historical information.
Currently, we do not plan to start monitoring (write a history for...) each system process in Advanced Monitoring. If you really need to deeply investigate something in the system on the "per process" level, I suggest looking at `sar` ( sar (Unix) - Wikipedia )
Feature Suggestions – Your Ideas for Plesk
plesk.uservoice.com
Hi everyone,
I am glad to inform you about a new version of Advanced Monitoring, the release contains a few new features. The main feature of the release is allowing to monitor resource usage per each subscription. The feature has a dependency on the Cgroups Manager extension (it is a paid extension; the extension provides data of usage for graphs). It also means the functionality is available only on Linux servers (Windows as a system does not have a Cgroups feature).
Let me show how this functionality works:


That is all that I wanted to show you about the new feature of Advanced Monitoring")
Feel free to provide feedback or ask any questions. Thank you for your attention.
I am glad to inform you about a new version of Advanced Monitoring, the release contains a few new features. The main feature of the release is allowing to monitor resource usage per each subscription. The feature has a dependency on the Cgroups Manager extension (it is a paid extension; the extension provides data of usage for graphs). It also means the functionality is available only on Linux servers (Windows as a system does not have a Cgroups feature).
1.4.0 (22 December 2020)
With this feature, Plesk users can see how much resources their subscriptions consume. The Plesk administrator, in turn, can see and compare load between multiple subscriptions (up to 10).
- [+] Introduced the new "Enable integration with the Cgroups Manager" feature available for Plesk installations where the Plesk Cgroups Manager license is installed.
The feature will be gradually turned on: first on Plesk servers that have fewer than 10 subscriptions. However, the Plesk administrator can turn on the feature for servers with a larger number of subscriptions by adding the following lines to the panel.ini file:
[ext-monitoring]
allowCgroupsManagerIntegration = true
- [+] It is now possible to specify the default time range for all graphs in Advanced Monitoring (Settings > Parameters).
- [+] Plesk UI "critical" notifications related to Advanced Monitoring now contain recommendations on how to fix the reported issues.
- [-] Clicking the "Check server health" button in Plesk UI "OK" notifications now leads to the correct Advanced Monitoring tab. (EXTPLESK-1990)
Let me show how this functionality works:
- When you open Advanced Monitoring first time after enabling the feature, the short tour informs you about the new options in the Settings.
- As I have mentioned, the feature has a dependency on the Cgroups Manager extension, it is a paid extension. If the license is installed, the drawer with settings will look like the next screen:
- Let’s enable all settings and check what is changed in Plesk:
- The second checkbox adds a new button/link to each subscription:
- Enabling the third checkbox allows a server admin to compare the usage load of different subscription on the server to each other
That is all that I wanted to show you about the new feature of Advanced Monitoring
Feel free to provide feedback or ask any questions. Thank you for your attention.
Hello, Im trying to configure Plesk Grafana in a Raspberry Kiosk.
I created an user for this propuse (rpi), but when I try to display in the TV, the following message appears:
I think that these message appears because the Browser in the TV does not logged directly to Plesk. My question is if I can see Grafana using an account created inside Grafana.
Cheers.
I created an user for this propuse (rpi), but when I try to display in the TV, the following message appears:
{"error":"access_denied","error_description":"The resource owner or authorization server denied the request.","hint":"Plesk session is not initialized","message":"The resource owner or authorization server denied the request."}
I think that these message appears because the Browser in the TV does not logged directly to Plesk. My question is if I can see Grafana using an account created inside Grafana.
Cheers.
Similar threads
- Replies
- 5
- Views
- 1K