• If you are still using CentOS 7.9, it's time to convert to Alma 8 with the free centos2alma tool by Plesk or Plesk Migrator. Please let us know your experiences or concerns in this thread:
    CentOS2Alma discussion

Question Apache & PHP-FPM memory usage spike and no CPU usage

anthill

New Pleskian
Hi,

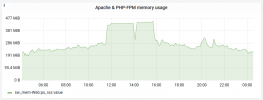
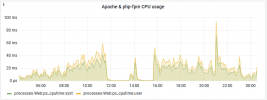
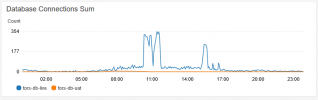
I'm struggling to narrow down some really high spikes in apache and php-fpm memory usage, which coinsides with a complete drop in apache and php-fpm cpu usage. See attached images.

This is causing a gateway timeout message on the website during these memory spikes.

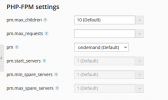
I've gone through the syslog but nothing stands out as the culprit? Can anyone suggest where to look or has had similar issues.

Note: This doesn't appear to happen at regular times. It happened yesterday when traffic was relatively low (bank holiday monday)


Attachments

  • high-memory.png
    high-memory.png
    24.4 KB · Views: 12
  • low-cpu.png
    low-cpu.png
    43.2 KB · Views: 10
Please check /var/log/messages and /var/log/apache2/* logs (/httpd/* logs) for entries that refer to webserver restarts or other issues. I think that the drop in cpu activity means that the web server is not doing anything any longer. Maybe the logs show the reason for the outage.
 
Thanks for the reply. Don't have /var/log/messages. Can't see anything worthwhile in the httpd logs other than the 504 reponses. We are using nginx as a proxy and are seeing lots of these entries in the proxy logs:

2021/08/30 11:35:13 [error] 278301#0: *6391166 upstream timed out (110: Connection timed out) while reading response header from upstream, client

i've also attached the php-fpm settings which are unchanged from plesk defaults

This has happened today. Nothing obvious in logs or using top/process list at the time. I restarted apache and the site restored.
 

Attachments

  • php-fpm_settings.png
    php-fpm_settings.png
    20.7 KB · Views: 19
What type of server do you have if you don't have /var/log/messages on it? What operating system?
 
Nothing in the syslog that suggests anything around the times the peak starts (around 11:30)

Aug 30 11:25:01 plesk-user cron[687]: (psaadm) RELOAD (crontabs/psaadm)
Aug 30 11:25:01 plesk-user CRON[1059202]: (root) CMD (command -v debian-sa1 > /dev/null && debian-sa1 1 1)
Aug 30 11:25:01 plesk-user CRON[1059203]: (panopta-agent) CMD ( /usr/bin/python /usr/bin/panopta-agent/panopta_agent.py --from-cron &> /dev/null)
Aug 30 11:26:01 plesk-user CRON[1059223]: (panopta-agent) CMD ( /usr/bin/python /usr/bin/panopta-agent/panopta_agent.py --from-cron &> /dev/null)
Aug 30 11:26:55 plesk-user snapd[711194]: storehelpers.go:551: cannot refresh: snap has no updates available: "core18", "lxd", "snapd"
Aug 30 11:26:55 plesk-user snapd[711194]: autorefresh.go:513: auto-refresh: all snaps are up-to-date
Aug 30 11:27:01 plesk-user CRON[1059245]: (panopta-agent) CMD ( /usr/bin/python /usr/bin/panopta-agent/panopta_agent.py --from-cron &> /dev/null)
Aug 30 11:28:01 plesk-user CRON[1059262]: (panopta-agent) CMD ( /usr/bin/python /usr/bin/panopta-agent/panopta_agent.py --from-cron &> /dev/null)
Aug 30 11:29:01 plesk-user CRON[1059296]: (panopta-agent) CMD ( /usr/bin/python /usr/bin/panopta-agent/panopta_agent.py --from-cron &> /dev/null)
Aug 30 11:30:01 plesk-user CRON[1059318]: (root) CMD (command -v debian-sa1 > /dev/null && debian-sa1 1 1)
Aug 30 11:30:01 plesk-user CRON[1059320]: (panopta-agent) CMD ( /usr/bin/python /usr/bin/panopta-agent/panopta_agent.py --from-cron &> /dev/null)
Aug 30 11:30:01 plesk-user CRON[1059323]: (root) CMD (/var/scripts/process_audit_emails.sh >/dev/null 2>&1)
Aug 30 11:31:01 plesk-user CRON[1059341]: (panopta-agent) CMD ( /usr/bin/python /usr/bin/panopta-agent/panopta_agent.py --from-cron &> /dev/null)
Aug 30 11:32:01 plesk-user CRON[1059363]: (psaadm) CMD (/opt/psa/admin/bin/php -dauto_prepend_file=sdk.php '/opt/psa/admin/plib/modules/revisium-antivirus/scripts/ra_executor_run.php')
Aug 30 11:32:01 plesk-user CRON[1059366]: (panopta-agent) CMD ( /usr/bin/python /usr/bin/panopta-agent/panopta_agent.py --from-cron &> /dev/null)
Aug 30 11:32:01 plesk-user check-quota[1059392]: Starting the check-quota filter...
Aug 30 11:32:01 plesk-user plesk sendmail[1059391]: handlers_stderr: SKIP
Aug 30 11:32:01 plesk-user plesk sendmail[1059391]: SKIP during call 'check-quota' handler
Aug 30 11:33:01 plesk-user CRON[1059455]: (panopta-agent) CMD ( /usr/bin/python /usr/bin/panopta-agent/panopta_agent.py --from-cron &> /dev/null)
Aug 30 11:34:01 plesk-user CRON[1059523]: (panopta-agent) CMD ( /usr/bin/python /usr/bin/panopta-agent/panopta_agent.py --from-cron &> /dev/null)
Aug 30 11:35:01 plesk-user CRON[1059545]: (panopta-agent) CMD ( /usr/bin/python /usr/bin/panopta-agent/panopta_agent.py --from-cron &> /dev/null)
Aug 30 11:35:01 plesk-user CRON[1059546]: (root) CMD ([ -x /opt/psa/admin/sbin/backupmng ] && /opt/psa/admin/sbin/backupmng >/dev/null 2>&1)
Aug 30 11:35:01 plesk-user CRON[1059549]: (root) CMD (command -v debian-sa1 > /dev/null && debian-sa1 1 1)
Aug 30 11:36:01 plesk-user CRON[1059559]: (panopta-agent) CMD ( /usr/bin/python /usr/bin/panopta-agent/panopta_agent.py --from-cron &> /dev/null)
Aug 30 11:37:01 plesk-user CRON[1059580]: (psaadm) CMD (/opt/psa/admin/bin/php -dauto_prepend_file=sdk.php '/opt/psa/admin/plib/modules/sslit/scripts/keep-secured.php')
Aug 30 11:37:01 plesk-user CRON[1059581]: (panopta-agent) CMD ( /usr/bin/python /usr/bin/panopta-agent/panopta_agent.py --from-cron &> /dev/null)
Aug 30 11:38:01 plesk-user CRON[1059602]: (panopta-agent) CMD ( /usr/bin/python /usr/bin/panopta-agent/panopta_agent.py --from-cron &> /dev/null)
Aug 30 11:38:01 plesk-user CRON[1059603]: (psaadm) CMD (/opt/psa/admin/bin/php -dauto_prepend_file=sdk.php '/opt/psa/admin/plib/modules/monitoring/scripts/detect-hardware-changes.php')
 
Your Apache webserver simply fails for a yet unknown reason. That is why the cpu usage drops and the timeout of the response to Nginx occurs. The goal must be to find out why the Apache web server becomes unresponsive.

For example, have you configured graceful restarts for Apache so that Apache does not restart each time a configuration change is applied? There must also be a log entry for either the failure or the web server restart. If it is not in your syslog file, it is somewhere else. There should also be an output with a reason for the failure when you request the service status from your operating system like
# service apache2 status
This should give an excerpt of the latest log entries that might mention an issue.
 
Hi,

Apologies for not replying sooner. I've taken your advice and have been doing my own investigations.

We are still having this issue but its slightly different.

We are still seeing random spikes in memory but not a drop in CPU as before.

Attached is a graph of CPU and Apache & php-fpm memory. When the Apache & php-fpm gets above circa 954MiB we get uers complaining the site is going slow.

When it gets about 1.2GiB users start seeing gateway timeouts and the site becomes unresponsive. First thing i did was to restart apache and the php-fpm processes which cause a very slight dip in the apache ram usage, but immediately it started increasing again. The big drop in CPU is when i gave up and rebooted the whole VPS. As soon as it came back online the usage ramped up once again.

The VPS itself has 6 cores and 24Gig of RAM so why isn't appache utilising these resources effectively?

At times such as the spike shown, we are seeing 50 (as allocated) php-fpm process all using around the same amount of resource, i.e. less that 1% cpu and ram. So not one single process seems to be the the single cause.

Additionally, at this point we are also seeing a hugh spike in database connections (AWS RDS - see other attachment) . For as many db connections we are also seeing a lot of db connections in a sleep state.

Any help is much appreciated.
 

Attachments

  • high-memory2.png
    high-memory2.png
    121.7 KB · Views: 12
  • db-connections.png
    db-connections.png
    12.6 KB · Views: 12
Your problem is that either a search bot opens a lot of connections very quickly or someone tries DOS on the domain.

Check this by opening the log file acess_ssl.log for the domain concerned and looking there for entries of an IP address from which many page views take place in quick succession.

You can then block this IP address with the firewall
 
Hi. Thanks for your reply.

I've been looking at the access logs and can't see any major spikes. I did see AhrefsBot was crawling links which i've since prevented in the robots.txt but i'm not sure if this could have been related. I also forgot to mention the website uses Wordpress 5.8 but also has a lot of custom PHP with a persisten db connection.
 
In that case, you may need to upgrade from 24 to 32 GB of RAM or more to avoid such bottlenecks.

Then, with more ram, you should check your database settings and carefully increase the value for Connections.
 
but where is the bottleneck? I did try increasing the processes from 10 to 20, then 20 to 50, then 50 to 80 then 80 to 100 (over a period of days), yet still, when the Apache and PHP memory went above circa 954MiB the same symptoms occured.
 
but where is the bottleneck?

There ;)
the website uses Wordpress 5.8 but also has a lot of custom PHP with a persisten db connection.
Your note above, in connection with what is quoted, indicate that the connection: Database / Php / Webbrowser / Nginx is running out of resources somewhere and one in the row gets stuck. (Gateway timeout ...)

Either the settings of those involved must be optimized or the RAM must be increased so that all processes involved can use enough RAM to prevent a crash.

You could also ensure that database connections are closed again immediately after they have been used (minimize the persisten db connections) , and thus released. But then your CPU will be more stressed.
 
Back
Top