Hi,
I have an issue with the graphs that are generated by Grafana.
The global server graphs in the monitoring extension are just fine, but the subscriptions graphs have gaps in it. It's not just this server, other servers have the same issues.
This is the graph of one of the subscriptions:

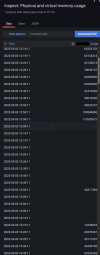
This is the data that Grafana collects:

What's going on here?
There is no relation with the load on the server.
Latest update of RRDTools didn't make a difference.
CentOS Linux 7.9.2009 (Core) / Plesk Obsidian Version 18.0.42
I have an issue with the graphs that are generated by Grafana.
The global server graphs in the monitoring extension are just fine, but the subscriptions graphs have gaps in it. It's not just this server, other servers have the same issues.
This is the graph of one of the subscriptions:

This is the data that Grafana collects:

What's going on here?
There is no relation with the load on the server.
Latest update of RRDTools didn't make a difference.
CentOS Linux 7.9.2009 (Core) / Plesk Obsidian Version 18.0.42
