• If you are still using CentOS 7.9, it's time to convert to Alma 8 with the free centos2alma tool by Plesk or Plesk Migrator. Please let us know your experiences or concerns in this thread:
    CentOS2Alma discussion

Forwarded to devs No graphs in monitoring after grafana-8.3.6-1.x86_64 update

Maarten.

Golden Pleskian
Plesk Guru
Username:

TITLE

No graphs in monitoring after grafana-8.3.6-1.x86_64 update

PRODUCT, VERSION, OPERATING SYSTEM, ARCHITECTURE

CentOS Linux 7.9.2009 (Core)
Plesk Obsidian Version 18.0.41 Update #1

PROBLEM DESCRIPTION

After the grafana-8.3.6-1.x86_64 update, the graphs don't work anymore.
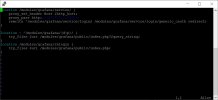
The logs show this error:

msg="Could not start plugin" logger=plugin.manager pluginId=grafana-simple-json-backend-datasource err="Incompatible API version with plugin."

STEPS TO REPRODUCE

Update to the latest grafana as offered by Plesk.
Open Monitoring

ACTUAL RESULT

Monitoring show empty graphs with a "origin not allowed" not allowed error.

EXPECTED RESULT

To see the graphs.

ANY ADDITIONAL INFORMATION

(DID NOT ANSWER QUESTION)

YOUR EXPECTATIONS FROM PLESK SERVICE TEAM

Help with sorting out
 
This seems to be the issue:

 
I've downgraded grafana on our servers to the last version to get the graphs back:

Code:
yum downgrade grafana-8.3.4-1.x86_64
 
The issue is known, waiting for the bugfix from Grafana.
As a temporary workaround:

1. Add the proxy_set_header Host $http_host; line to the /etc/sw-cp-server/conf.d/grafana_plesk.inc file right above the proxy_pass entry in the 'location' section so the contents like follows:

location /modules/grafana/service/ {
proxy_set_header Host $http_host;
proxy_pass http://127.0.0.1:3030/;
rewrite ^/modules/grafana/service/login$ /modules/grafana/service/login/generic_oauth redirect;
}
...

2. Reload the sw-cp-server service with the command:

# systemctl reload sw-cp-server.service
 
GREAT thanks
The issue is known, waiting for the bugfix from Grafana.
As a temporary workaround:

1. Add the proxy_set_header Host $http_host; line to the /etc/sw-cp-server/conf.d/grafana_plesk.inc file right above the proxy_pass entry in the 'location' section so the contents like follows:

location /modules/grafana/service/ {
proxy_set_header Host $http_host;
proxy_pass http://127.0.0.1:3030/;
rewrite ^/modules/grafana/service/login$ /modules/grafana/service/login/generic_oauth redirect;
}
...

2. Reload the sw-cp-server service with the command:

# systemctl reload sw-cp-server.service
GREAT thanks
but is there possibility to exclude from upgrading GRAFANA automatically?
due every time there is a problem related...
 
GREAT thanks

GREAT thanks
but is there possibility to exclude from upgrading GRAFANA automatically?
due every time there is a problem related...

In this case it's a small fix, you only have to add 1 line to the config file.

I wouldn't skip updates because it's not just bugfixes and enhancements but also security fixes:

 
The issue is known, waiting for the bugfix from Grafana.
As a temporary workaround:

1. Add the proxy_set_header Host $http_host; line to the /etc/sw-cp-server/conf.d/grafana_plesk.inc file right above the proxy_pass entry in the 'location' section so the contents like follows:

location /modules/grafana/service/ {
proxy_set_header Host $http_host;
proxy_pass http://127.0.0.1:3030/;
rewrite ^/modules/grafana/service/login$ /modules/grafana/service/login/generic_oauth redirect;
}
...

2. Reload the sw-cp-server service with the command:

# systemctl reload sw-cp-server.service
I have the same problem, but the suggested quick fix does not help me. The proxy_set_header is already set. Reloading or restarting grafana does not help either. Maybe another way to solve this?
 

Attachments

  • 2022-02-24_LI.jpg
    2022-02-24_LI.jpg
    684.6 KB · Views: 7
Update for Grafana extension has been published, fixing the issue by adding the proxy_set_header by default - bugfix EXTPLESK-3382
 
Update for Grafana extension has been published, fixing the issue by adding the proxy_set_header by default - bugfix EXTPLESK-3382
Hi Igor,

I installed Plesk 18.0.42 just now on my Ubuntu 20.04.4 LTS. But I see no improvement on the monitoring. I still get "origin not allowed". As I mentioned before, the proxy_set_header is set. Grafana version is 8.3.6. The extension Grafana says version 1.3.2-286. Have I missed something?
 
Hi,

Can you show the contents of this file please: /etc/sw-cp-server/conf.d/grafana_plesk.inc

Are there any monitoring related errors in these files?

/var/log/grafana/grafana.log
/var/log/plesk/panel.log
 
Hi,

Can you show the contents of this file please: /etc/sw-cp-server/conf.d/grafana_plesk.inc

Are there any monitoring related errors in these files?

/var/log/grafana/grafana.log
/var/log/plesk/panel.log
I just did a reinstall of monitoring and grafana. After that no change in grafana_plesk.inc:

location /modules/grafana/service/ { proxy_set_header Host $http_host; proxy_pass http://127.0.0.1:3030/; rewrite ^/modules/grafana/service/login$ /modules/grafana/service/login/generic_oauth redirect; } location ~ ^/modules/grafana/(d|p)/ { try_files $uri /modules/grafana/public/index.php?$query_string; } location /modules/grafana/relogin { try_files $uri /modules/grafana/public/index.php; }

The gafana.log has the following after the reinstall:

t=2022-03-03T20:17:15+0100 lvl=eror msg="Organization not found" logger=context userId=1 orgId=1 uname=admin error="organization not found" remote_addr=127.0.0.1 t=2022-03-03T20:17:17+0100 lvl=warn msg="falling back to legacy setting of 'min_interval_seconds'; please use the configuration option in the `unified_alerting` section if Grafana 8 alerts are enabled." logger=settings t=2022-03-03T20:17:19+0100 lvl=warn msg="Permitting unsigned plugin. This is not recommended" logger=plugin.signature.validator pluginID=plesk-json-backend-datasource pluginDir=/var/lib/grafana/plugins/plesk-json-backend-datasource/dist t=2022-03-03T20:17:26+0100 lvl=eror msg="Failed to look up user based on cookie" logger=context error="user token not found"
 
Hi,

Can you show the contents of this file please: /etc/sw-cp-server/conf.d/grafana_plesk.inc

Are there any monitoring related errors in these files?

/var/log/grafana/grafana.log
/var/log/plesk/panel.log
BTW: I have another plesk server with comparable settings (Ubuntu 20.04.4 LTS). But not updated to 18.0.42 and with no reinstall of monitoring or grafana. grafana_plesk.inc is the same. This I see in the grafana.log. This is the complete log. The issue was only after the update Grafana was updated to version 1.3.2

t=2022-01-29T01:59:58+0100 lvl=eror msg="Failed to get user with id" logger=context userId=2 error="context canceled" t=2022-02-01T01:19:08+0100 lvl=warn msg="falling back to legacy setting of 'min_interval_seconds'; please use the configuration option in the `unified_alerting` section if Grafana 8 alerts are enabled." logger=settings t=2022-02-01T01:19:09+0100 lvl=warn msg="Permitting unsigned plugin. This is not recommended" logger=plugin.signature.validator pluginID=plesk-json-backend-datasource pluginDir=/var/lib/grafana/plugins/plesk-json-backend-datasource/dist t=2022-02-23T04:49:07+0100 lvl=warn msg="falling back to legacy setting of 'min_interval_seconds'; please use the configuration option in the `unified_alerting` section if Grafana 8 alerts are enabled." logger=settings t=2022-02-23T04:49:08+0100 lvl=warn msg="Permitting unsigned plugin. This is not recommended" logger=plugin.signature.validator pluginID=plesk-json-backend-datasource pluginDir=/var/lib/grafana/plugins/plesk-json-backend-datasource/dist t=2022-02-23T04:49:11+0100 lvl=warn msg="falling back to legacy setting of 'min_interval_seconds'; please use the configuration option in the `unified_alerting` section if Grafana 8 alerts are enabled." logger=settings
 
Can you open the extension Grafana and see if there are organizations, data sources and status = ok?
If you click on "Open application", you should see the Grafana dashboard.

On the Grafana dashboard, click on the avatar at the bottom of the left sidebar and click on "Sign Out". It should do a reset and log back in. In the url there must be something like "/modules/grafana/service/?orgId=1"
 
If that still doesn't solve anything, please contact Plesk support:

 
Can you open the extension Grafana and see if there are organizations, data sources and status = ok?
If you click on "Open application", you should see the Grafana dashboard.

On the Grafana dashboard, click on the avatar at the bottom of the left sidebar and click on "Sign Out". It should do a reset and log back in. In the url there must be something like "/modules/grafana/service/?orgId=1"
Thanks for the suggestion. But it does not solve the problem. I reported it to your Plesk partner.
 
Can you open the extension Grafana and see if there are organizations, data sources and status = ok?
If you click on "Open application", you should see the Grafana dashboard.

On the Grafana dashboard, click on the avatar at the bottom of the left sidebar and click on "Sign Out". It should do a reset and log back in. In the url there must be something like "/modules/grafana/service/?orgId=1"
Hi Maarten, On github I stumbled on some comments about ProxyPreserveHost (Unable to Create/Save Dashboard after v8.3.5 Update · Issue #45117 · grafana/grafana) Could that have something to do with this. Because I don't have nginx (or ipv6), only apache. If this can resolve the problem, clould you tell me which files to change? Greetings, Frank
 
Hi,

That explains a lot. I've no idea which files to change as it isn't a standard config the way Plesk added Grafana.
Why don't you use nginx?
 
Hi,

That explains a lot. I've no idea which files to change as it isn't a standard config the way Plesk added Grafana.
Why don't you use nginx?
It was not installed on my Plesk server on delivery. I could install it, but the websites I moved there were built without nginx as well. Installing nginx could maybe make a mess of it all. So I'd still like to make Grafana work without nginx.
 
Back
Top