eilko
Regular Pleskian
Username:
TITLE
CPU chart not working in dashboard
PRODUCT, VERSION, OPERATING SYSTEM, ARCHITECTURE
Plesk Obsidian 18.0.72 Update #1 Web Pro Edition
AlmaLinux 10.0 (Purple Lion)
PROBLEM DESCRIPTION
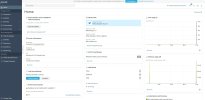
The default dashboard shows two graphs: one with CPU and one with memory usage. The memory graph loads perfectly. The CPU one says: Data will be prepared in a few minutes. These minutes takes forever.
The graph is showing perfectly in the local monitoring page within Plesk.
STEPS TO REPRODUCE
install new Plesk 18.0.72 on Almalinux 10
See default dashboard
disable graph
enable graph
ACTUAL RESULT
No graph
EXPECTED RESULT
A working chart
ANY ADDITIONAL INFORMATION
(DID NOT ANSWER QUESTION)
YOUR EXPECTATIONS FROM PLESK SERVICE TEAM
Confirm bug
TITLE
CPU chart not working in dashboard
PRODUCT, VERSION, OPERATING SYSTEM, ARCHITECTURE
Plesk Obsidian 18.0.72 Update #1 Web Pro Edition
AlmaLinux 10.0 (Purple Lion)
PROBLEM DESCRIPTION
The default dashboard shows two graphs: one with CPU and one with memory usage. The memory graph loads perfectly. The CPU one says: Data will be prepared in a few minutes. These minutes takes forever.
The graph is showing perfectly in the local monitoring page within Plesk.
STEPS TO REPRODUCE
install new Plesk 18.0.72 on Almalinux 10
See default dashboard
disable graph
enable graph
ACTUAL RESULT
No graph
EXPECTED RESULT
A working chart
ANY ADDITIONAL INFORMATION
(DID NOT ANSWER QUESTION)
YOUR EXPECTATIONS FROM PLESK SERVICE TEAM
Confirm bug