• We value your experience with Plesk during 2024
    Plesk strives to perform even better in 2025. To help us improve further, please answer a few questions about your experience with Plesk Obsidian 2024.
    Please take this short survey:

    https://pt-research.typeform.com/to/AmZvSXkx
  • The Horde webmail has been deprecated. Its complete removal is scheduled for April 2025. For details and recommended actions, see the Feature and Deprecation Plan.
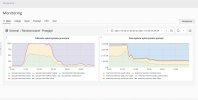
  • We’re working on enhancing the Monitoring feature in Plesk, and we could really use your expertise! If you’re open to sharing your experiences with server and website monitoring or providing feedback, we’d love to have a one-hour online meeting with you.

Question CPU usage and webserver optimizing

moim

New Pleskian
Hi guys,

I am contacting you in the context of our store. Works on the basis of Wordpress / WooCommerce. We have about 25000 monthly sessions and 15,000 users per month. Problems begin on Sunday products deliveries at 9:30 pm, when on the site at one time is about 300-400 users and website goes down (a lot of errors like this: 2021/10/24 21:30:45 [error] 17777#0: *52788 connect() failed (110: Connection timed out) while connecting to upstream)

Wordpress is quite well optimized, it uses caching, minifications, CDN, lazy-loading photos. Rating of our website performance according to GTmetrix is B (84% performance, 93% structure)

We currently use VPS (4v core, 8gb ram, 1gbps), but I manage the server myself (apache + nginx proxy) using Plesk and mostly default settings.

Whether the hardware resources of the server are enough? Maybe we should use 8v core and 16 gb ram? What can we do to improve optimizing web server?

best regards
Daniel Prochowicz
 

Attachments

  • screenshot-plesk.jpg
    screenshot-plesk.jpg
    234.4 KB · Views: 37
  • screenshot-plesk-2.jpg
    screenshot-plesk-2.jpg
    241.5 KB · Views: 37
  • screenshot-plesk-3.jpg
    screenshot-plesk-3.jpg
    262.8 KB · Views: 33
  • screenshot-plesk-4.jpg
    screenshot-plesk-4.jpg
    122.1 KB · Views: 35
Please also show RAM monitoring. You have to make sure the machine does not start swapping, so the actually used portion of RAM should not be more than ~90%.
What do you use as CDN?
CPU usage of system is rather high. This might indicate that the VPS host is hitting limits, too. But that's something only the VPS admin can tell.

Depending on how dynamic your pages are, you might profit from varnish.
 
thank you for the anserw, i'm using Photon/Jatpack CDN, i have only one website on my VPS, look at my RAM monitoring
 

Attachments

  • plesk-screenshot-5.jpg
    plesk-screenshot-5.jpg
    207.8 KB · Views: 21
Could you zoom in a bit? It is hard to see the peak of the green curve.

VPS host is the physical machine your (and others') VPS runs on. Ask your provider whether they can see if your VPS hits shared resource limits.
 
Memory_limit 1024MB is very high if there is no specific reason for it.
128 MB ~ 384 MB should be sufficient for most scripts.
Hardware: 8v core and 32 gb ram and ssd
 
Test your SQL-Setting.
Download mysqltuner, run it in ssh with: ./mysqltuner.pl --checkversion --updateversion an follow the suggestions.
But before, upgrade the hardware...
 
Do not use mpm_prefork with Apache2, use mpm_event with the following settings:
Path: /etc/apache2/mods-enabled/mpm_event.conf

(Settings for: 32GB Ram)
Code:
<IfModule mpm_event_module> 
    KeepAlive On
    KeepAliveTimeout 5 
    MaxKeepAliveRequests 128
    ServerLimit 10
    StartServers 4
    ThreadLimit 128 
    ThreadsPerChild 128 
    MinSpareThreads 256 
    MaxSpareThreads 512 
    MaxRequestWorkers 640 
    MaxConnectionsPerChild 2048
</IfModule>
 
Test your SQL-Setting.
Download mysqltuner, run it in ssh with: ./mysqltuner.pl --checkversion --updateversion an follow the suggestions.
But before, upgrade the hardware...
Addendum:
If the Mysqltuner script recommends to set the join_buffer_size higher than 4 MB you should definitely ignore this!
4 MB are completely sufficient here!
 
Logging is unfortunately not fine enough. Something happens between 21:40 and 21:45, eating up RAM and thereby lowering the amount of cache, then probably crashing so the RAM is free again.
 
Do not use mpm_prefork with Apache2, use mpm_event with the following settings:
Path: /etc/apache2/mods-enabled/mpm_event.conf

(Settings for: 32GB Ram)
Code:
<IfModule mpm_event_module>
    KeepAlive On
    KeepAliveTimeout 5
    MaxKeepAliveRequests 128
    ServerLimit 10
    StartServers 4
    ThreadLimit 128
    ThreadsPerChild 128
    MinSpareThreads 256
    MaxSpareThreads 512
    MaxRequestWorkers 640
    MaxConnectionsPerChild 2048
</IfModule>

before i gonna edit mpm_event.conf i want to make sure if "forked" means mpm_prefork u mentioned it? how i can turn it off?
sorry but i'm a rookie ;-)
 

Attachments

  • apache-screenshot-V.jpg
    apache-screenshot-V.jpg
    181.5 KB · Views: 18
i upragaded VPS to 8v core, 32 gb ram and ssd nvme; MPM was already set with EVENT option; i changed settings of mpm_event.conf according your suggestions... look at my list of processes now, what do u think about CPU usage of php-fpm? it's ok? and what with php settings? can i improve optimization of php?
 

Attachments

  • ssh-mpm_event.jpg
    ssh-mpm_event.jpg
    240.9 KB · Views: 25
  • screenshot-listaprocesow.jpg
    screenshot-listaprocesow.jpg
    172.5 KB · Views: 24
  • php-01.png
    php-01.png
    137.5 KB · Views: 25
  • php-02.png
    php-02.png
    104.5 KB · Views: 24
Logging is unfortunately not fine enough. Something happens between 21:40 and 21:45, eating up RAM and thereby lowering the amount of cache, then probably crashing so the RAM is free again.

at this time hundreds of users refreshing website, about 22:00 i rebooted server so maybe thats the reason of lowering the amount of cache
 
That looks ok so far.
With that you shouldn't run into problems again anytime soon.
You have to observe this for a few weeks now, at the latest when it gets tight again, report back here ...

I would now set the value for Memory_limit to 128 MB and only increase it slowly when errors occur.
 
unfortunately still problems :-(
 

Attachments

  • plesk-screenshot-1-7-11-21.jpg
    plesk-screenshot-1-7-11-21.jpg
    193.4 KB · Views: 30
  • plesk-screenshot-2-7-11-21.jpg
    plesk-screenshot-2-7-11-21.jpg
    283.7 KB · Views: 29
I mean, as expected HTTPD/PHP are burning up most of your cycles. There isn't really a whole lot you can do about that. Some minor tuning can be done (rp/op caching w/ PHP) - but importantly, are you using any server caching with WordPress?
 
I mean, as expected HTTPD/PHP are burning up most of your cycles. There isn't really a whole lot you can do about that. Some minor tuning can be done (rp/op caching w/ PHP) - but importantly, are you using any server caching with WordPress?

thanks for your reply, as i mentioned before, i have OVH VPS (8v core, 32 GB ram, ssd) i have enabled nginx (in proxy mode) cache (64M / 5 sec), php opcache enabled also and use WP Fastest Cache on Wordpress
is it not enough? you suggest to use server caching like memecached or varnish? is it can help to improve the webserver and help handle with 300 users at one time?
 
Back
Top