- Server operating system version
- AlmaLinux 8.8 (Sapphire Caracal)
- Plesk version and microupdate number
- Product: Plesk Obsidian 18.0.53 Update #2, last updated on June 21, 2023 03:44 AM
Dears,
my site is wordpress+woocommerce on dedicated server (Dell PowerEdge R250; Intel® Xeon® E-2324G 4x 3.10 GHz; 32 GB DDR4 - ECC).
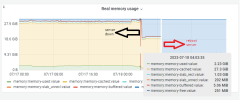
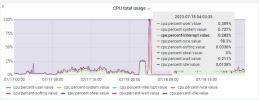
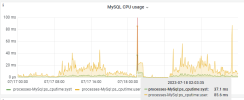
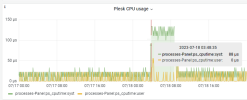
This morning I couldn't open any page of my site from any computer/IP.
My browser gave me always ERR_CONNECTION_TIMED_OUT. E-mail connection wasn't possible, last e-mail update on my phone was at 3:34 am.
I wasn't at home so the quickly action was accessing to idrac and perform the power cycle system (cold boot). After that, the server and the site started working again.
Now, I want to understand what happened.
Here the error_log:
Here the access_log:
After that I have no recent logs.
Can you please suggest me where can I check further logs in order to understand what happened?
Thank you in advance
my site is wordpress+woocommerce on dedicated server (Dell PowerEdge R250; Intel® Xeon® E-2324G 4x 3.10 GHz; 32 GB DDR4 - ECC).
This morning I couldn't open any page of my site from any computer/IP.
My browser gave me always ERR_CONNECTION_TIMED_OUT. E-mail connection wasn't possible, last e-mail update on my phone was at 3:34 am.
I wasn't at home so the quickly action was accessing to idrac and perform the power cycle system (cold boot). After that, the server and the site started working again.
Now, I want to understand what happened.
Here the error_log:
The IP is Google but there are few requests. After that there are only logs at 8am when I tried to open the site.[Tue Jul 18 02:32:04.337043 2023] [fcgid:warn] [pid 331675:tid 140329894258432] [client 66.249.70.12:0] mod_fcgid: stderr: PHP Warning: Trying to access array offset on value of type bool in /var/www/vhosts/ribes.style/httpdocs/wp-content/plugins/woocommerce/includes/wc-template-functions.php on line 2673
[Tue Jul 18 02:39:02.233042 2023] [fcgid:warn] [pid 331675:tid 140330184771328] [client 66.249.70.12:0] mod_fcgid: stderr: PHP Warning: Trying to access array offset on value of type bool in /var/www/vhosts/ribes.style/httpdocs/wp-content/plugins/woocommerce/includes/wc-template-functions.php on line 2673
[Tue Jul 18 02:45:54.918928 2023] [fcgid:warn] [pid 299971:tid 140329458067200] [client 66.249.70.11:0] mod_fcgid: stderr: PHP Warning: Trying to access array offset on value of type bool in /var/www/vhosts/ribes.style/httpdocs/wp-content/plugins/woocommerce/includes/wc-template-functions.php on line 2673
[Tue Jul 18 02:59:48.543227 2023] [fcgid:warn] [pid 331675:tid 140329902651136] [client 66.249.70.13:0] mod_fcgid: stderr: PHP Warning: Trying to access array offset on value of type bool in /var/www/vhosts/ribes.style/httpdocs/wp-content/plugins/woocommerce/includes/wc-template-functions.php on line 2673
[Tue Jul 18 03:06:43.785580 2023] [fcgid:warn] [pid 299971:tid 140329441281792] [client 66.249.70.12:0] mod_fcgid: stderr: PHP Warning: Trying to access array offset on value of type bool in /var/www/vhosts/ribes.style/httpdocs/wp-content/plugins/woocommerce/includes/wc-template-functions.php on line 2673
[Tue Jul 18 03:37:51.952215 2023] [fcgid:warn] [pid 300188:tid 140328904410880] [client 66.249.70.11:0] mod_fcgid: stderr: PHP Warning: Trying to access array offset on value of type bool in /var/www/vhosts/ribes.style/httpdocs/wp-content/plugins/woocommerce/includes/wc-template-functions.php on line 2673
Here the access_log:
This second log is anomalous, because I have not plugins that someone tried to open and the ip is reported on abuseipdb.5.9.101.220 - - [18/Jul/2023:01:19:45 +0200] "GET /alfa-rex.php7 HTTP/1.1" 301 162 "www.google.com" "Mozlila/5.0 (Linux; Android 7.0; SM-G892A Bulid/NRD90M; wv) AppleWebKit/537.36 (KHTML, like Gecko) Version/4.0 Chrome/60.0.3112.107 Moblie Safari/537.36"
94.102.208.129 - - [18/Jul/2023:02:30:29 +0200] "GET /wp-content/plugins/ehjsu/ng.php HTTP/1.1" 301 162 "www.ribes.style" "Mozilla/5.0 (Windows NT 10.0; Win64; x64) AppleWebKit/587.38 (KHTML, like Gecko) Chrome/74.0.3729.169 Google/569 Safari/537.36"
94.102.208.129 - - [18/Jul/2023:02:30:35 +0200] "GET /wp-content/plugins/fbajs/ng.php HTTP/1.1" 301 162 "www.ribes.style" "Mozilla/5.0 (Windows NT 10.0; Win64; x64) AppleWebKit/587.38 (KHTML, like Gecko) Chrome/74.0.3729.169 Google/569 Safari/537.36"
94.102.208.129 - - [18/Jul/2023:02:31:50 +0200] "GET /wp-content/plugins/coba4/output/drunk.PHp HTTP/1.1" 301 162 "www.ribes.style" "Mozilla/5.0 (Windows NT 10.0; Win64; x64) AppleWebKit/587.38 (KHTML, like Gecko) Chrome/74.0.3729.169 Google/569 Safari/537.36"
94.102.208.129 - - [18/Jul/2023:02:34:11 +0200] "GET /wp-content/plugins/okbtp/ng.php HTTP/1.1" 301 162 "www.ribes.style" "Mozilla/5.0 (Windows NT 10.0; Win64; x64) AppleWebKit/587.38 (KHTML, like Gecko) Chrome/74.0.3729.169 Google/569 Safari/537.36"
94.102.208.129 - - [18/Jul/2023:02:34:32 +0200] "GET /wp-content/plugins/rpobm/ng.php HTTP/1.1" 301 162 "www.ribes.style" "Mozilla/5.0 (Windows NT 10.0; Win64; x64) AppleWebKit/587.38 (KHTML, like Gecko) Chrome/74.0.3729.169 Google/569 Safari/537.36"
94.102.208.129 - - [18/Jul/2023:02:35:23 +0200] "GET /wp-content/plugins/coba5/output/drunk.PHp HTTP/1.1" 301 162 "www.ribes.style" "Mozilla/5.0 (Windows NT 10.0; Win64; x64) AppleWebKit/587.38 (KHTML, like Gecko) Chrome/74.0.3729.169 Google/569 Safari/537.36"
94.102.208.129 - - [18/Jul/2023:02:35:30 +0200] "GET /wp-content/plugins/dsjoj/ng.php HTTP/1.1" 301 162 "www.ribes.style" "Mozilla/5.0 (Windows NT 10.0; Win64; x64) AppleWebKit/587.38 (KHTML, like Gecko) Chrome/74.0.3729.169 Google/569 Safari/537.36"
94.102.208.129 - - [18/Jul/2023:02:35:50 +0200] "GET /wp-content/plugins/qllcp/ng.php HTTP/1.1" 301 162 "www.ribes.style" "Mozilla/5.0 (Windows NT 10.0; Win64; x64) AppleWebKit/587.38 (KHTML, like Gecko) Chrome/74.0.3729.169 Google/569 Safari/537.36"
94.102.208.129 - - [18/Jul/2023:02:35:56 +0200] "GET /wp-content/plugins/wp-file-explorer/output/drunk.PHp HTTP/1.1" 301 162 "www.ribes.style" "Mozilla/5.0 (Windows NT 10.0; Win64; x64) AppleWebKit/587.38 (KHTML, like Gecko) Chrome/74.0.3729.169 Google/569 Safari/537.36"
After that I have no recent logs.
Can you please suggest me where can I check further logs in order to understand what happened?
Thank you in advance


