• If you are still using CentOS 7.9, it's time to convert to Alma 8 with the free centos2alma tool by Plesk or Plesk Migrator. Please let us know your experiences or concerns in this thread:
    CentOS2Alma discussion

Issue Huge load average, uninterruptible state

MMagnani

New Pleskian
Hello,

I've been struggling with huge (50 to 100+) load average incidents. The server becomes unresponsive and sometimes not even SSH connection is possible. This is how they typically appear in Plesk Advanced Monitoring.


Nothing helpful is found in system logs and, when possible, all I can see is a cumulative number of uninterruptible php-fpm processes of WordPress instances. If I'm lucky and fast enough to log in, restarting apache2 service almost always solves the problem.

The events occur randomly, from 3 times a day to once a week. Sometimes they recover to normal levels from 30 minutes to 5 hours. If not, then only a VPS forceful stop and restart can overcome the issue. Months ago, the problem became quite worse when MySQL remote access had to be allowed.

This is an AWS instance, running updated Ubuntu 18.04 and latest Plesk Obsidian, host of dozens of low-traffic WordPress instances on PHP 7.4 served by Apache and local MySQL. No mail services except msmtp to external server.

External abusive actors are constantly probing WordPress installations for vulnerable code. Fail2ban is set to manage them and usually bans tens of IPs, but there were days where that amount grew to hundreds.

Although kind and attentive, Plesk Support has not been able to identify the cause or provide effective help.

Nothing seems to indicate that the uninterruptible state is due to disk operation. After some research, it is said that they may be caused by pending cURL operations to unresponsive external sources. This way, some change in timeouts of cURL or FPM (like request_terminate_timeout) might solve the problem.

Would anybody agree with the timeout limit suggestion? If so, how to implement them server-wide?

If not, any other thought, help or suggestion is more than welcome!

Thanks!
 
Hi, AYamshanov

I see increasing in "cpu:percent-wait" "cpu: percent-wait" (usually CPU waits for disk) and memory usage. Is there any information about swap using?

Swap usage increases as expected, but there is no change in disk throughput.

What exactly type of AWS instant is used? Is it t2/t3/t4 instance type? If yes, maybe CPU credits and baseline utilization for burstable performance instances - Amazon Elastic Compute Cloud could help.

It is a burstable t3, but AFAIK that feature is not useful for blocked processes.

I was able to get some information with SysRq, but I don't know if they are helpful:

Code:
# echo w > /proc/sysrq-trigger; dmesg

(...)

[ 3114.538000] php-fpm         D    0  5851    954 0x00004000
[ 3114.538001] Call Trace:
[ 3114.538003]  __schedule+0x292/0x710
[ 3114.538004]  ? wbt_cleanup_cb+0x20/0x20
[ 3114.538005]  ? __wbt_done+0x40/0x40
[ 3114.538007]  schedule+0x33/0xa0
[ 3114.538008]  io_schedule+0x16/0x40
[ 3114.538010]  rq_qos_wait+0x101/0x160
[ 3114.538011]  ? sysv68_partition+0x2d0/0x2d0
[ 3114.538013]  ? wbt_cleanup_cb+0x20/0x20
[ 3114.538014]  wbt_wait+0x9f/0xe0
[ 3114.538016]  __rq_qos_throttle+0x28/0x40
[ 3114.538018]  blk_mq_make_request+0xeb/0x5a0
[ 3114.538020]  ? get_swap_bio+0xe0/0xe0
[ 3114.538021]  generic_make_request+0x121/0x300
[ 3114.538022]  submit_bio+0x46/0x1c0
[ 3114.538023]  ? submit_bio+0x46/0x1c0
[ 3114.538024]  ? get_swap_bio+0xe0/0xe0
[ 3114.538025]  ? get_swap_bio+0xe0/0xe0
[ 3114.538027]  __swap_writepage+0x289/0x430
[ 3114.538029]  ? __frontswap_store+0x73/0x100
[ 3114.538031]  swap_writepage+0x34/0x90
[ 3114.538032]  pageout.isra.58+0x11d/0x350
[ 3114.538034]  shrink_page_list+0x9eb/0xbb0
[ 3114.538037]  shrink_inactive_list+0x204/0x3d0
[ 3114.538039]  shrink_node_memcg+0x3b4/0x820
[ 3114.538041]  ? shrink_slab+0x279/0x2a0
[ 3114.538042]  ? shrink_slab+0x279/0x2a0
[ 3114.538043]  shrink_node+0xb5/0x410
[ 3114.538045]  ? shrink_node+0xb5/0x410
[ 3114.538046]  do_try_to_free_pages+0xcf/0x380
[ 3114.538048]  try_to_free_pages+0xee/0x1d0
[ 3114.538050]  __alloc_pages_slowpath+0x417/0xe50
[ 3114.538051]  ? __switch_to_asm+0x40/0x70
[ 3114.538053]  ? __switch_to_asm+0x40/0x70
[ 3114.538054]  ? __switch_to_asm+0x34/0x70
[ 3114.538055]  ? __switch_to_asm+0x40/0x70
[ 3114.538057]  ? __switch_to_asm+0x40/0x70
[ 3114.538058]  ? __switch_to_asm+0x40/0x70
[ 3114.538060]  ? __switch_to_asm+0x40/0x70
[ 3114.538061]  __alloc_pages_nodemask+0x2cd/0x320
[ 3114.538063]  alloc_pages_vma+0x88/0x210
[ 3114.538065]  __read_swap_cache_async+0x15f/0x230
[ 3114.538066]  read_swap_cache_async+0x2b/0x60
[ 3114.538067]  swap_cluster_readahead+0x211/0x2b0
[ 3114.538069]  ? xas_store+0x372/0x5f0
[ 3114.538070]  swapin_readahead+0x60/0x4e0
[ 3114.538072]  ? swapin_readahead+0x60/0x4e0
[ 3114.538073]  ? pagecache_get_page+0x2c/0x2c0
[ 3114.538075]  do_swap_page+0x31b/0x990
[ 3114.538076]  ? do_swap_page+0x31b/0x990
[ 3114.538078]  __handle_mm_fault+0x7ad/0x1270
[ 3114.538080]  handle_mm_fault+0xcb/0x210
[ 3114.538081]  __do_page_fault+0x2a1/0x4d0
[ 3114.538083]  do_page_fault+0x2c/0xe0
[ 3114.538084]  do_async_page_fault+0x54/0x70
[ 3114.538086]  async_page_fault+0x34/0x40
[ 3114.538087] RIP: 0033:0x7f41b67e7c85
[ 3114.538089] Code: Bad RIP value.
[ 3114.538089] RSP: 002b:00007ffdf73a9758 EFLAGS: 00010202
[ 3114.538090] RAX: 00007f4196923000 RBX: 00007f41b3000040 RCX: 00007f41968a2760
[ 3114.538091] RDX: 0000000000000780 RSI: 00007f41968a2000 RDI: 00007f4196923000
[ 3114.538092] RBP: 00007f41968a2000 R08: 0000000000000000 R09: 00007f41969237e0
[ 3114.538093] R10: 0000000000123000 R11: 00007f41969237e0 R12: 0000000001059420
[ 3114.538093] R13: 00007f4196923000 R14: 000000000000003d R15: 00007f41b30fab58
[ 3114.538095] php-fpm         D    0  5856    954 0x00000000
[ 3114.538096] Call Trace:
[ 3114.538098]  __schedule+0x292/0x710
[ 3114.538100]  ? psi_memstall_leave+0x61/0x70
[ 3114.538101]  schedule+0x33/0xa0
[ 3114.538102]  io_schedule+0x16/0x40
[ 3114.538103]  swap_readpage+0x1b1/0x1f0
[ 3114.538105]  read_swap_cache_async+0x40/0x60
[ 3114.538106]  swap_cluster_readahead+0x211/0x2b0
[ 3114.538108]  ? blk_mq_request_issue_directly+0x4b/0xe0
[ 3114.538110]  shmem_swapin+0x63/0xb0
[ 3114.538112]  ? shmem_swapin+0x63/0xb0
[ 3114.538113]  ? __switch_to_asm+0x40/0x70
[ 3114.538116]  ? radix_tree_node_ctor+0x50/0x50
[ 3114.538120]  ? call_rcu+0x10/0x20
[ 3114.538121]  ? xas_store+0x3bc/0x5f0
[ 3114.538124]  shmem_swapin_page+0x4ce/0x660
[ 3114.538125]  ? xas_load+0xc/0x80
[ 3114.538126]  ? find_get_entry+0x5e/0x180
[ 3114.538129]  shmem_getpage_gfp+0x323/0x8d0
[ 3114.538131]  shmem_fault+0x9d/0x200
[ 3114.538132]  ? xas_find+0x16f/0x1b0
[ 3114.538134]  __do_fault+0x57/0x110
[ 3114.538135]  __handle_mm_fault+0xdde/0x1270
[ 3114.538138]  handle_mm_fault+0xcb/0x210
[ 3114.538139]  __do_page_fault+0x2a1/0x4d0
[ 3114.538141]  do_page_fault+0x2c/0xe0
[ 3114.538142]  do_async_page_fault+0x54/0x70
[ 3114.538144]  async_page_fault+0x34/0x40
[ 3114.538145] RIP: 0033:0x7f41b2b4bc67
[ 3114.538147] Code: Bad RIP value.
[ 3114.538147] RSP: 002b:00007ffdf73aa000 EFLAGS: 00010283
[ 3114.538148] RAX: 000055a13ab4f780 RBX: 00007f419fb64bc0 RCX: 0000000000000003
[ 3114.538149] RDX: 0000000000000000 RSI: 000000000000145e RDI: 000055a13af132f0
[ 3114.538150] RBP: 00007f41988630e0 R08: 0000000000000001 R09: 0000000000000065
[ 3114.538150] R10: 000055a13ab348a0 R11: 0000000000000001 R12: 000055a13af132f0
[ 3114.538151] R13: 00007f41b2da8be0 R14: 00007f419fb718a0 R15: 00007f419fb71880

(...)

# cat /proc/5851/stat

5851 (php-fpm) S 954 954 954 0 -1 4194624 38649 0 5246 0 317 141 0 0 20 0 1 0 277098 596934656 21312 18446744073709551615 94150955266048 94150960230696 140728751284192 0 0 0 0 4096 67127815 1 0 0 17 0 0 0 24508 0 0 94150962331624 94150962927160 94150966906880 140728751292137 140728751292183 140728751292183 140728751292376 0


Thank you!
 
Seems to me like a memory issue, based off the stats and sysrq.

A few things
- Would love to see more stats. FPM/Event Workers, FPM/Event configuration, resource break down by process
- If you lose access to SSH, you should be able to shell into the instance some otherway not-involving sshd. IE, it looks like AWS provides SSM: Resolve "Connection refused" or "Connection timed out" Errors When Connecting to an EC2 Instance with SSH
- While decreasing timeouts could help, that's not the issue here - there's something running/happening that's eating up your resources.
- If you're tracking this (which you really should) - MPM, FPM scoreboard when it happens would be helpful too.
- Any OOM killer messages?
 
Thanks for your help, john0001

I'm not sure how to provide the mentioned information.

Sometimes not even OOM killer can manage the surge, but a recent event is attached.

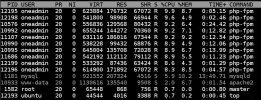
This is another typical top result when possible. Blurred usernames are WordPress customers.

top-uninterruptible.png


I've found some domains with absurd PHP parameters set by users in .user.ini and removing them has made issues a little less frequent.

Again, I welcome any help and thoughts about this issue.
 

Attachments

  • oom-killer_2021-04-13.pdf
    29.4 KB · Views: 7
Do you have the specific processes/users that use the most resources when the spikes happen?
 
I tried to trace if spikes were related to some user application but none seemed to be an obvious culprit.
Is above OOM killer log of any help?

The processes in uninterruptible D state start to pile up out of nothing. During the most busy times, with tens of simultaneous processes, the server deals fine with such high load.
 
Are you using the ModSecurity Comodo ruleset? If so, try switching to Atomic basic ruleset. It might solve the issue. Give it a try, it's a very low risk to switch the sets. Please report back whether this has solved the issue.
 
Looks like PHPFPM children are eating up your resources. Check which user/site they belong, and lower the limit. There's no reason you should get setting it to insane values. Generally CPU threads + 2 at most.
 
Similar issue is been faced by me currently. As soon as I start my server php-fpm processes take up the cpu to 100% utilization.
In error_log it shows AH01075: Error dispatching request to AND AH01067: Failed to read FastCGI header.
Have you guys got any solution?
 
Similar issue is been faced by me currently. As soon as I start my server php-fpm processes take up the cpu to 100% utilization.
In error_log it shows AH01075: Error dispatching request to AND AH01067: Failed to read FastCGI header.
Have you guys got any solution?
Are you previously running FCGI?

What are you running? How powerful is the machine? What are you FPM configs?
 
Using Php Fpm served by Apache after issue tried switching once between fastcgi by apache and fpm by nginx to check if it resolves issue.
max execution time - 360
max imput time - 120
My machine 2 gb ram 1 core cpu running a single site.
My php config is php version 7.4.16 (i.e chgd from 8.0.3 after recommendation)
Php Fpm app served by Apache
opcache.enable = on
pm.max_children = 10
pm = "ondemand"


Resolutions I tried:
Tried increasing hardware configuration i.e server plan still issue arises.
Increasing innodb_log_file_size = 64M for error (AH01071 data inserted in one transaction is greater than 10% of redo log size. Increase the redo log size using innodb_log_file_size)
Increasing pm.max_children = 20
Increased/decreased max_execution_time, max_input_time, post_max_size
Enabling/disabling opcache
changing php versions 7.3, 7.4, 8.0.3
Adding/Removing additional apache directives like:
FcgidIdleTimeout 1200
FcgidProcessLifeTime 1200
FcgidConnectTimeout 1200
FcgidIOTimeout 1200
Timeout 1200
ProxyTimeout 1200
 
As I told the OP, setting your max_children to numbers far beyond # of cores is largely pointless. You're just increasing the number of context switches a CPU does. I'd lower that to 3, or at least run some benchmarks. Also pull a process list during the spike to see what's eating up your CPU.
 
So you say I should reduce the max children count to around 3 or 5
Yes. It's...not a one size fit's all thing. it will certainly depend on what your hosting, and how those sites are setup, and if you've got other bottlenecks in your stack, like IO/DB. If everything else is completely optimized, or it's pure PHP, then you want children = threads for maximum performance. Or maybe children = threads -1 if you have other services running. That said, most applications, say WP, aren't like that. They make many DB calls, read/write files, etc. In these cases, you'll want more children than threads, as threads can be "idle" if waiting on the DB, thereby not using CPU time. In this case, the worker would not be able to process new requests, so you'd want other workers to be able to pick up the slack.

In your case, I have no doubt that setting it to 20 will absolutely hurt your performance/scalability, and 10 is almost certainly too much, assuming this is a standard PHP CMS/WP. Try 3 or 5. Make sure it's set to ondemand.
 
I tried setting up with 5 max children to check how machine responds, but still it goes up the php fpm process. Also, yes I am using wordpress over this machine.
Mostly it would be around 2 threads as it's 1 core lightsail instance. Will Increasing the hardware config help with this. I think its some kind of bottleneck. I tried optimizing database. I before tried to increase the plan to 2 core 4 gb ram still it responded in a similar manner. Not sure but been facing this issue after plesk update 18.0.33/34.
 
Back
Top