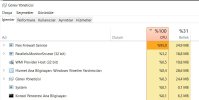
Hello, after the Flex Firewall Manager add-on, there is constantly high CPU usage and when I examine the system's event viewer, I see similar attempts, but I think it is constantly triggering the Flex Firewall and causing high CPU usage. What can I do about it?

The logging below shows that Flex has high CPU usage for no reason at 9:15 and continues unabated.
1 28.03.2025 09:54:44 Server CPU {96 %} : Paused Detection 3 min
2 28.03.2025 09:54:44 Server Performance : Low
3 28.03.2025 09:54:44 Server RAM : 30 %
4 28.03.2025 09:54:44 Server CPU : 96 %
5 28.03.2025 09:51:44 Server CPU {96 %} : Paused Detection 3 min
6 28.03.2025 09:51:44 Server Performance : Low
7 28.03.2025 09:51:44 Server RAM : 30 %
8 28.03.2025 09:51:44 Server CPU : 96 %
9 28.03.2025 09:48:44 Server CPU {96 %} : Paused Detection 3 min
10 28.03.2025 09:48:44 Server Performance : Low
11 28.03.2025 09:48:44 Server RAM : 30 %
12 28.03.2025 09:48:44 Server CPU : 96 %
13 28.03.2025 09:45:44 Server CPU {96 %} : Paused Detection 3 min
14 28.03.2025 09:45:44 Server Performance : Low
15 28.03.2025 09:45:44 Server RAM : 30 %
16 28.03.2025 09:45:44 Server CPU : 96 %
17 28.03.2025 09:42:44 Server CPU {96 %} : Paused Detection 3 min
18 28.03.2025 09:42:44 Server Performance : Low
19 28.03.2025 09:42:44 Server RAM : 28 %
20 28.03.2025 09:42:44 Server CPU : 96 %
21 28.03.2025 09:39:44 Server CPU {96 %} : Paused Detection 3 min
22 28.03.2025 09:39:44 Server Performance : Low
23 28.03.2025 09:39:44 Server RAM : 28 %
24 28.03.2025 09:39:44 Server CPU : 96 %
25 28.03.2025 09:36:42 Server CPU {96 %} : Paused Detection 3 min
26 28.03.2025 09:36:42 Server Performance : Low
27 28.03.2025 09:36:42 Server RAM : 28 %
28 28.03.2025 09:36:42 Server CPU : 96 %
29 28.03.2025 09:33:43 Server CPU {96 %} : Paused Detection 3 min
30 28.03.2025 09:33:43 Server Performance : Low
31 28.03.2025 09:33:42 Server RAM : 28 %
32 28.03.2025 09:33:42 Server CPU : 96 %
33 28.03.2025 09:30:42 Server CPU {96 %} : Paused Detection 3 min
34 28.03.2025 09:30:42 Server Performance : Low
35 28.03.2025 09:30:42 Server RAM : 28 %
36 28.03.2025 09:30:42 Server CPU : 96 %
37 28.03.2025 09:27:42 Server CPU {96 %} : Paused Detection 3 min
38 28.03.2025 09:27:42 Server Performance : Low
39 28.03.2025 09:27:42 Server RAM : 28 %
40 28.03.2025 09:27:42 Server CPU : 96 %
41 28.03.2025 09:24:42 Server CPU {96 %} : Paused Detection 3 min
42 28.03.2025 09:24:42 Server Performance : Low
43 28.03.2025 09:24:42 Server RAM : 28 %
44 28.03.2025 09:24:42 Server CPU : 96 %
45 28.03.2025 09:21:42 Server CPU {96 %} : Paused Detection 3 min
46 28.03.2025 09:21:42 Server Performance : Low
47 28.03.2025 09:21:42 Server RAM : 28 %
48 28.03.2025 09:21:42 Server CPU : 96 %
49 28.03.2025 09:18:42 Server CPU {96 %} : Paused Detection 3 min
50 28.03.2025 09:18:42 Server Performance : Low
51 28.03.2025 09:18:42 Server RAM : 28 %
52 28.03.2025 09:18:42 Server CPU : 96 %
53 28.03.2025 09:15:42 Server CPU {96 %} : Paused Detection 3 min
54 28.03.2025 05:17:21 185.142.236.34 Abuse IP {Permanent} : 185.142.236.34 - FTP
55 28.03.2025 05:12:41 Server Performance : OK
56 28.03.2025 05:12:41 Server RAM : 31 %
57 28.03.2025 05:12:41 Server CPU : 6 %
 ext.plesk.com