• We value your experience with Plesk during 2024
    Plesk strives to perform even better in 2025. To help us improve further, please answer a few questions about your experience with Plesk Obsidian 2024.
    Please take this short survey:

    https://pt-research.typeform.com/to/AmZvSXkx
  • The Horde webmail has been deprecated. Its complete removal is scheduled for April 2025. For details and recommended actions, see the Feature and Deprecation Plan.

Issue PHP suddenly crashes

FloLa

Basic Pleskian
Server operating system version
Debian 9.13
Plesk version and microupdate number
Version 18.0.44 Update #3
I don't know why, but lately I've been having the problem that suddenly, without any changes or really noticeable events in the logs, PHP just crashes and then only the following error is displayed in the access log:


25130#0: *26793910 connect() to unix:/var/www/vhosts/system/xxx.xxx.xxx/php-fpm.sock failed (11: Resource temporarily unavailable) while connecting to upstream

Of course, every web request then receives a 502 error.
As soon as I restart MariaDB it works again.
In my Zabbix monitoring environment I saw the following:

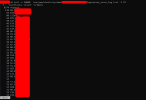
These are the processes:

PROC2.png

Otherwise nothing is unusual, does anyone have any idea which logs I can look at or what could be causing this error?
I set the setting "max_children" to 250, which should be fine for a 12 core and 32GB RAM.
 
Seeing as there are suddenly many PHP processes started (if I am reading your graph correctly), this very could very well be caused by a DDoS attack.

There is an related support article for the php-fpm.sock failed issue here:

If you like to diagnose your server logs for a potential DDoS attack this article might be helpful:
Many thanks for your response.
I don't think it's a DDOS attack because after restarting the database server it's immediately OK again and only occurs again after some time/days/months.
 
@FloLa Using an operating system that has not been supported for over two years is negligent. I really hope this server does not have any sensitive personal data on it. That said, the server likely has countless security vulnerabilities and other open bugs that can lead to memory issues, as mentioned. However, I would first suggest checking for a DDoS attack (normally just a bad crawler). Have you checked the access log and counted the number of requests per IP while the process list was growing? Please post the top 10 IPs and the number of requests (these can be anonymized).
 
@FloLa Using an operating system that has not been supported for over two years is negligent. I really hope this server does not have any sensitive personal data on it. That said, the server likely has countless security vulnerabilities and other open bugs that can lead to memory issues, as mentioned. However, I would first suggest checking for a DDoS attack (normally just a bad crawler). Have you checked the access log and counted the number of requests per IP while the process list was growing? Please post the top 10 IPs and the number of requests (these can be anonymized).
Thank you for your answer.
As @Kaspar@Plesk mentioned, I followed the steps above and the result is this:

1.png
2.png
There is actually nothing unusual, I also checked the IP addresses and the requests looked legitimate.
 
Please post the result of the following command:

Code:
awk '{ print $1 }' access_ssl_log | sort -n | uniq -c | sort -nr | head -10
 
Depending on the timeframe, 38,000 requests can be a lot. In one of the first screenshots, I also saw 60,000 requests from one IP. Some requests might be quite database-heavy and require a lot of processing time. I would check the processing time of my PHP scripts and maybe set a low limit for max_execution_time (e.g., 5, 10, 20, 30 seconds) to identify candidates that need more time and are consuming the available pool. Of course, a malware scan should also be considered.
 
Depending on the timeframe, 38,000 requests can be a lot. In one of the first screenshots, I also saw 60,000 requests from one IP. Some requests might be quite database-heavy and require a lot of processing time. I would check the processing time of my PHP scripts and maybe set a low limit for max_execution_time (e.g., 5, 10, 20, 30 seconds) to identify candidates that need more time and are consuming the available pool. Of course, a malware scan should also be considered.
The whole thing is a closed system and not actually publicly accessible. So you can access it from outside but it doesn't necessarily do anything.

Most requests are just mini-requests but of course there are some that can take hours so unfortunately the execution time is not an option.

I also have to say that this system has been completely stable for the last 4 years.
 
Then, I would try to check the database process list when the next instability occurs and/or activate the slow log or log all queries. Additionally, you should check the URLs in the access log that are currently triggering "hours" of PHP processing time. They might be causing the issue within the mentioned period of service downtime.
 
Then, I would try to check the database process list when the next instability occurs and/or activate the slow log or log all queries. Additionally, you should check the URLs in the access log that are currently triggering "hours" of PHP processing time. They might be causing the issue within the mentioned period of service downtime.
Thanks for the answers and your time, I will try to check this list the next time there is instability.
 
This console command will help to give you a live insight where the load in your server happens:

Code:
MYSQL_PWD=`cat /etc/psa/.psa.shadow` watch "uptime && echo "\ " && ps aux | sort -nrk 3,3 | head -n 20 && echo "\ " && mysqladmin proc status -u admin"
 
This console command will help to give you a live insight where the load in your server happens:

Code:
MYSQL_PWD=`cat /etc/psa/.psa.shadow` watch "uptime && echo "\ " && ps aux | sort -nrk 3,3 | head -n 20 && echo "\ " && mysqladmin proc status -u admin"
Thank you, I will check this command if I have problems again.
 
Back
Top