• We value your experience with Plesk during 2024
    Plesk strives to perform even better in 2025. To help us improve further, please answer a few questions about your experience with Plesk Obsidian 2024.
    Please take this short survey:

    https://pt-research.typeform.com/to/AmZvSXkx
  • The Horde webmail has been deprecated. Its complete removal is scheduled for April 2025. For details and recommended actions, see the Feature and Deprecation Plan.
  • We’re working on enhancing the Monitoring feature in Plesk, and we could really use your expertise! If you’re open to sharing your experiences with server and website monitoring or providing feedback, we’d love to have a one-hour online meeting with you.

Issue The swap usage threshold has been exceeded, every morning at 6:35

PeopleInside

Regular Pleskian
Server operating system version
Ubuntu 22.04.3 LTS
Plesk version and microupdate number
Version 18.0.55 Update #2
My server was having no downtime issue for weeks, now on this days every morning at 6:35 I get the alert of swap usage threshold has been exceeded.

1696843059419.png
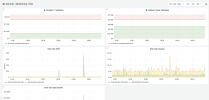
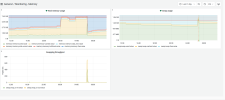
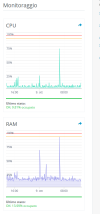
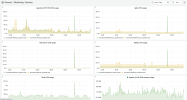
Looking at the Plesk Monitor I see an increase of the RAM use at 00:00
1696843109392.png
Seems this intense use persist until the downtime at the morning happen then the usage seems return to normal.
1696843186505.png
Disk usage:
1696843228423.png
1696843255746.png
1696843281264.pngDo you have any idea on how can understand what is wrong and how to avoid this downtime?

free -h
1696843323138.png

Thank you
 
If I run the command:
Code:
cat /proc/sys/vm/swappiness
I get as result 60, I'm asking if I should try to set this value to 10.
I read this in a discussion here on Plesk and in a external article.

I'm unable to understand why memory usage seems high from the midnight to the morning 6:35. I see this in the graphic above.
Looks strange.
 
Another strange thing that I'm unable to understand is: staying at Plesk Monitor graphic seems my RAM reached the 100 % or more then 7 GB when total RAM is 8 GB. Looking at hosting resource monitoring I don't find this high usage of the RAM.

Near the 6 of morning seems there is an high usage of the CPU and RAM but not since 00:00 as I can see in Plesk Monitor.

1696850831693.png
It would be nice if I can get some help to understand why all morning near the 6 and 35 I get this high usage and short downtime.
Maybe I set some settings in Plesk that help services to restart so the downtime is only two minutes instead to be permanent until I manually restart.
 
It would be nice if I can get some help to understand why all morning near the 6 and 35 I get this high usage and short downtime.
Maybe I set some settings in Plesk that help services to restart so the downtime is only two minutes instead to be permanent until I manually restart.
As you can see in /etc/crontab, at 6:25 each script in /etc/cron.daily is started, which does updates, backup, and other plesk tasks.
You seem to also have a task like update-slocate running at 0:00 which does some disk I/O and fills the cache. That is not a problem, it's supposed to use otherwise free ram for cache as the cache can just be discarded when the ram is needed again. And it's probably why the hosting monitoring doesn't report anything.
When the 6:25 tasks eat up application memory, the cache is discarded. But it is not enough, it goes deeply into swap, and eventually starts killing processes when none is left.
Interesting here is however that according to the graphs it doesn't even reach the limits at 6:35, evident in that you still have cache after the event. Possible reasons:
  • some program wants to allocate a huge amount of memory, most likely a bug or really bad programming
  • the host itself is running out of memory because a lot of plesk instances all want to run their daily tasks at the same time
Thank you for the reply.
 
Back
Top