• Please be aware: Kaspersky Anti-Virus has been deprecated
    With the upgrade to Plesk Obsidian 18.0.64, "Kaspersky Anti-Virus for Servers" will be automatically removed from the servers it is installed on. We recommend that you migrate to Sophos Anti-Virus for Servers.
  • The Horde webmail has been deprecated. Its complete removal is scheduled for April 2025. For details and recommended actions, see the Feature and Deprecation Plan.
  • We’re working on enhancing the Monitoring feature in Plesk, and we could really use your expertise! If you’re open to sharing your experiences with server and website monitoring or providing feedback, we’d love to have a one-hour online meeting with you.

Issue 504 Gateway Time-out since days from a specific subdomain

PeopleInside

Regular Pleskian
Server operating system version
Ubuntu 22.04.1 LTS
Plesk version and microupdate number
18.0.48
I never had this issue before that started some days ago and still having it.
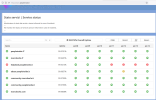
The issue is visible here: UpTime Siti Web Marco Borla - Powered by HetrixTools
1673695848867.png
The subdomain helpdesk.peopleinside.it continue to go down.
The issue loading the address is
504 Gateway Time-out
nginx

1673695922086.png

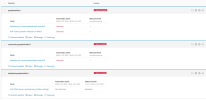
If I go on Plesk, Tool & settings, website log check under helpdesk.peopleinside.it I found:
PHP-FPM "server reached max_children setting"

I have already increased the limit from default 10 to 50 but still have the issue: randomly after some hours of uptime, a 504 error occur.
1673696123879.png
I never had this issue before in more than a year.
Now I don't know hot to solve, I'm having downtime due to this error since jan 11 2023

Any suggestion?
 
I will downgrade PHP from 8.2 to 8.1 to see if this can resolve the issue.
Maybe the only change I can remind is the upgrade of the PHP but I don't think to have done this recently, not for sure on those week where I'm facing the downtime issue.

I'm unable to understand why I have this dowtime error just in one subdomain.
I checked also the server resources and are not busy means my CPU and RAM are not and has not reached the 100% so looks like to be something that happen on Apache and nginx
 
Maybe the subdomain is under attack or bad bots are on to it? Do you see many requests that don't make much sense in the access_ssl_log for example?
 
Thank for the answer.
I dont see any strange visit, just the external uptime check that I always have that check if website are up or down.
I will see if the downgrade of the PHP can resolve the issue.

The HelpDesk I'm using is not supporting fully yet PHP 8.2 and Wordpress maybe too... Looks strange to me the cause can be this also because the subdomain that continue to go down has no Wordpress installation.

Other domain are working.
I will monitor if happen again also with PHP 8.1, if happen again I really dont know what to do.

Thanks again.
I will update here if I still get downtime with PHP 8.1
 
Maybe also try to lower the max runtime of a PHP script. It could be that some are caught in an infinite loop so they run very long, hence their instances don't clear quickly enough so that new requests can no longer be handled.
 
Downgrading the PHP version seems resolved the downtime issue but maybe the issue can be also happen because I was enable just one PHP 8.2 and not all version of the PHP 8.2. When you open the PHP settings you have not just two row with PHP 8.1 and PHP 8.2 but many other subcategory PHP services. Maybe I need to have enabled all. In any case seems I stopped the downtime issue.
Thank you for your help.
 
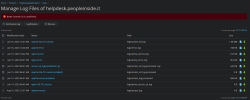
When I open the domain, subdomain Logs on top I see a red message:
Error: Domain ID is undefined.

1673826464644.png

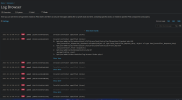
If I go on Log Browser I see there are many Plesk errors:
Code:
Invalid controller specified (icons):
0: /opt/psa/admin/plib/vendor/plesk/zf1/library/Zend/Controller/Dispatcher/Standard.php:248
    Zend_Controller_Dispatcher_Standard->dispatch(object of type Zend_Controller_Request_Http, object of type Zend_Controller_Response_Http)
1: /opt/psa/admin/plib/vendor/plesk/zf1/library/Zend/Controller/Front.php:954
    Zend_Controller_Front->dispatch()
2: /opt/psa/admin/plib/pm/Application.php:87
    pm_Application->run()
3: /opt/psa/admin/htdocs/modules/log-browser/index.php:4

1673826338398.png

I am asking if this can be related to the downtime issue I having only on one subdomain.
I still cannot understand why my helpdesk subdomain continue to stop working and never get uptime again until I dont log in Plesk and restart services in some way.
 
Have you tried to run
# plesk repair db -y
to fix database inconsistencies?
This command given on root give the following results:
Code:
Checking the Plesk database using the native database server tools .. [OK]

Checking the structure of the Plesk database ........................ [OK]

Checking the consistency of the Plesk database ...................... [OK]

Error messages: 0; Warnings: 0; Errors resolved: 0
 
Hi, someone can help me to made a sh script that check:
If the subdomain give the 504 error restart PHP ?

I'm unable to resolve this downtime issue and a simply restart of the PHP when down happen seems helps.
I don't know how resolve if with not an automatic script help.

I'm having long downtime to my helpdesk system, the strange things is that on the same customer I have multiple domains and subdomains, only the helpdesk give the 504 error and need a manual intervention (restart PHP) or never will go up again.
 
Interesting find other user having 504 Timeout error but maybe in my case is different.

This morning I had again a downtime of my helpdesk at 10:17 AM, if I check the subdomain error log /var/www/vhosts/example.com/logs/proxy_error_log as described in the guide "Website hosted at Plesk is unavailable: 504 Gateway Time-out" about today I can just find:

>> Open Log File <<


Is this log helpful? I don't' think.

In the /var/www/vhosts/example.com/logs/error_log about today I have:

>> Open Log File <<
 
The error log is the wrong place to look at in this case. Check your access_ssl_log instead for significant number of requests and bad bots. I'd also suggest to exclude bots either by fail2ban jail or by an .htaccess rule like
Code:
RewriteEngine On
RewriteBase /
RewriteCond %{HTTP_USER_AGENT} (seobility|PetalBot|UptimeRobot|seocompany|LieBaoFast|SEOkicks|Uptimebot|Cliqzbot|ssearch_bot|domaincrawler|AhrefsBot|spot|DigExt|Sogou|MegaIndex.ru|majestic12|80legs|SISTRIX|HTTrack|Semrush|MJ12|MJ12bot|MJ12Bot|Ezooms|CCBot|TalkTalk|Ahrefs|BLEXBot) [NC] 
RewriteRule .* - [F]
 
I have two uptime services that pings my domain.
If I look into access_ssl_log I see that bots.
Nothing wrong.

Also... is not only the uptime that alert me the website is not reachable, if also I open from my browser the page say 504 Time out so is not the bot that is banned and the issue is only for bot, the uptime bot are right, every visitor will see 504 time out... so why a bot can have the power to put a domain down?

Why this never happen on other domains monitored by the same uptime bot?

Peter, how access_ssl_log can be the reply to this issue?
The downtime happen at 10:10 this morning, I don't see any strange log in access_ssl_log , nothing that explain why this morning my server just one subdomain went again offline with 504 not only for uptime bot, even for me, for everyone.

Can developers help me to understand where look and where can be the cause?
Currently seems I'm not seeing any log that explain me why, after a year of Plesk, now a subdomain go down with 504 error for everyone not only for some IP and I need restart the PHP to resolve this downtime or will be never auto-resolve.
 
It is not about your uptime monitoring, it is about bad bots (maybe) or a misconfiguration of the website. Uptime monitoring is not a problem, but what can be a problem is when a high number of visits is requesting PHP scripts from your server over and over again. This can be hidden in rewrite requests, too. But it must be visible in the access log.

Restarting PHP works for you, because it kills all running PHP instances so that for some while your server can respond to new requests. But that does not solve the issue. The issue is that your scripts are overloading the server. And normally they do it because of malicious bots hitting the website. There is really no other way than to understanding the logs to find the reason for it. You can still add the above mentioned bad bot blocking sequence to the beginning of the .htaccess file of the site. It won't hurt.
 
Peter, thanks for the explain.
I don't see any bad bot visiting my subdomain that get down.

Maybe can be the helpdesk code that may have an issue in the code and as the uptime bot check every minute if the website is up or down, this cause many request that is not terminated?

I should find somewhere a log that tell me to much PHP instance are active?
I suppose the access_ssl_log show me only who has requested the subdomain, never show why I get 504 error.

I really don't understand why I start to get this just recently and again, in the log I see only my uptime bot.
Can or should add a rule to auto terminate request of PHP if they are too much? How can be sure this will be the real issue? Umh...
 
Now seems my IP get 504 error but if I use a different IP the website is up.
In the fail2ban there is no banned IP so where the IP can be banned?
On Ubuntu?
What is causing 504 timeout? Really hard to get what is happening.
 
Very strange: is not the IP banned.
If I open the incognito mode works, if not I get 504 time out from ngix.

The strange things is when the uptime alert the website is down is down also for me.
Now I was working in help desk and get 504 error page.
I can load the help desk if i load an incognito windows or open the URL from a different device.

Where can be the block?
 
Maybe it is a security function within the helpdesk software that is monitoring the number of requests from the same IP and does not respond to that IP once a threshold has been exceeded? That would explain why anonymous browsing allows you to access the page while your normal IP is no accepted, yet it is not due to a fail2ban ban. Maybe there was an update to the helpdesk software or a security plugin has been installed or activated?
 
Back
Top