Caspar
New Pleskian
Hi all,
I am baffled by the following:
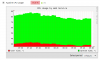
I get frequent e-mails that there is HIGH (red) CPU usage for "Apache CPU" (where I see the process is sw-engine). In the monitoring I see this for the Apache also, but when I look there is hardly any CPU usage in the total (everything below 10%)
The e-mail that is send should send only red messages if CPU is above 50%
This system has 2 vCPU cores so it isn't something that should trigger it if I look at it, even if it would be using 50% of CPU of one core (which should be 25%)
Also trying to find this, I only sometimes see a high CPU of the sw-engine-fpm module for Plesk pool, but even that is not that high (while I haven't gotten an e-mail from "red to green")
Looking with htop I don't see that high usage ( load avarage while I'm looking now is .03 .22 .22)
When running the following I also am not wiser:
I looked for updates, but I don't see anything, and the monitoring e-mails keep coming quite often.
Can anyone help me either to pinpoint the issue, or to figure out if this a. is a bug and b. solve this "bug".
Using:
Ubuntu 16.04.2 LTS
Plesk Onyx Version 17.5.3 Update #13, last updated on July 14, 2017 06:26 AM
Thanks!
I am baffled by the following:
I get frequent e-mails that there is HIGH (red) CPU usage for "Apache CPU" (where I see the process is sw-engine). In the monitoring I see this for the Apache also, but when I look there is hardly any CPU usage in the total (everything below 10%)
The e-mail that is send should send only red messages if CPU is above 50%
This system has 2 vCPU cores so it isn't something that should trigger it if I look at it, even if it would be using 50% of CPU of one core (which should be 25%)
Also trying to find this, I only sometimes see a high CPU of the sw-engine-fpm module for Plesk pool, but even that is not that high (while I haven't gotten an e-mail from "red to green")
Looking with htop I don't see that high usage ( load avarage while I'm looking now is .03 .22 .22)
When running the following I also am not wiser:
Code:
ps -o %cpu,%mem,cmd -C sw-engine
%CPU %MEM CMD
 0.0  1.0 /usr/bin/sw-engine -c /opt/psa/admin/conf/php.ini /usr/lib/plesk-9.0/psa-health-monitor-notification.php
 0.0  0.8 /usr/bin/sw-engine -c /opt/psa/admin/conf/php.ini /opt/psa/admin/bin/modules/watchdog/wdcollect -c /opt/psa/etc/modules/watchdog/wdcollect.inc.php
 0.0  1.3 /usr/bin/sw-engine -c /opt/psa/admin/conf/php.ini -dauto_prepend_file=sdk.php /opt/psa/admin/plib/modules/plesk-mobile/scripts/push_worker.php
I looked for updates, but I don't see anything, and the monitoring e-mails keep coming quite often.
Can anyone help me either to pinpoint the issue, or to figure out if this a. is a bug and b. solve this "bug".
Using:
Ubuntu 16.04.2 LTS
Plesk Onyx Version 17.5.3 Update #13, last updated on July 14, 2017 06:26 AM
Thanks!