• If you are still using CentOS 7.9, it's time to convert to Alma 8 with the free centos2alma tool by Plesk or Plesk Migrator. Please let us know your experiences or concerns in this thread:
    CentOS2Alma discussion

Issue high SQL cpu and possible slowlog issue?

Coopsy

Basic Pleskian
Hi - im hoping someone can help or point me in the right direction. I check the TOP logs regularly and the mysql always seems to be at the very top with very high CPU and not many domains being accessed.
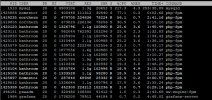
sql.JPG

I was advised to create and run a SLOWLOG (if thats right) and i ran this and looks like there might be an issue with a database called PSA - not got a clue what this is used for or how to correct any possible issues.
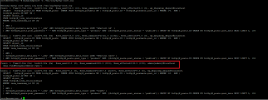
slowlog.png
 
The "FindWrongIncrements" is a procedure of the Plesk database check (# plesk repair db -y). It is always very slow, but this is no problem for the server. The procedure is normally not used in everyday operation.

To see what MySQL is really doing, open an interface and run
> show processlist;

Repeat the command several times and compare the outputs. Are there users who are constantly running queries? These could be the culprits for a slow database server.

The top output for the database server can be misleading.
 
There is two possibilities:
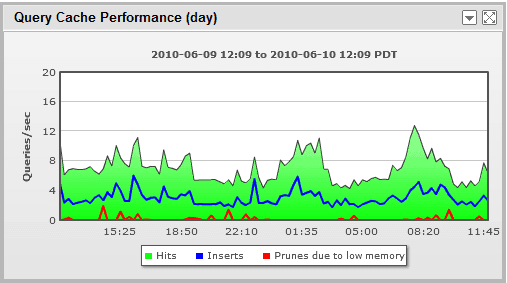
a) Your query cache is too small.
b) Your query cache is too large.
I'd guess that (b) is the likely cause. What happens here is that your query cache is very big, so that each request needs to go through the cache entries to seek a match. This takes a lot of time. While the one process is not finished, a second one is waiting, a third one, a fourth one ... You may need to check your /etc/my.cnf configuration for buffer sizes, e.g. innodb_buffer_pool_size, but also other caching options.

Here's more on this, but you'll find tons of similar stuff on the Internet:
Thanks Peter. I dont have/see a file called my.cnf in the /etc folder ?
 
The location of my.cnf depends on your operating system. It could also be located here: /etc/mysql/my.cnf or similar path logic.
 
The location of my.cnf depends on your operating system. It could also be located here: /etc/mysql/my.cnf or similar path logic.
Ah perfect, that was the place. Ive found the following in /etc/mysql/mariadb.conf.d/50-server.cnf
can you tell me if this is the file i need to alter and are these "not ideal"
#
# * Fine Tuning
#
#key_buffer_size = 16M
#max_allowed_packet = 16M
#thread_stack = 192K
#thread_cache_size = 8
# This replaces the startup script and checks MyISAM tables if needed
# the first time they are touched
#myisam_recover_options = BACKUP
#max_connections = 100
#table_cache = 64
#thread_concurrency = 10

#
# * Query Cache Configuration
#
#query_cache_limit = 1M
query_cache_size = 16M
 
All lines starting with a # are comments and not applied to the configuration. I'd set the query_cache_size to no more than 1 MB, then restart the database server and see if the locks disappear or at least disappear faster than before.
 
perfect thank you. I think ive updated it, is there a command in SSH to see what the current query cache would be to ensure its "set" ?
 
On Linux:
# plesk db

then in the command line interface of the database:
show variables LIKE 'query_cache_size';
 
On Linux:
# plesk db

then in the command line interface of the database:
show variables LIKE 'query_cache_size';
thank you - this it what it show. (sorry about this, its new to me and just want to sort out any issues)

MariaDB [psa]> show variables LIKE 'query_cache_size';
+------------------+----------+
| Variable_name | Value |
+------------------+----------+
| query_cache_size | 16777216 |
+------------------+----------+
1 row in set (0.001 sec)
 
Once again, you need to edit your my.cnf file, enter the desired value, then restart your database server for the new settings to take effect.
 
this is all the my.cnf file shows:
# The MariaDB configuration file
#
# The MariaDB/MySQL tools read configuration files in the following order:
# 1. "/etc/mysql/mariadb.cnf" (this file) to set global defaults,
# 2. "/etc/mysql/conf.d/*.cnf" to set global options.
# 3. "/etc/mysql/mariadb.conf.d/*.cnf" to set MariaDB-only options.
# 4. "~/.my.cnf" to set user-specific options.
#
# If the same option is defined multiple times, the last one will apply.
#
# One can use all long options that the program supports.
# Run program with --help to get a list of available options and with
# --print-defaults to see which it would actually understand and use.

#
# This group is read both both by the client and the server
# use it for options that affect everything
#
[client-server]

# Import all .cnf files from configuration directory
!includedir /etc/mysql/conf.d/
!includedir /etc/mysql/mariadb.conf.d/
[mysqld]
#slow_query_log = 1
#slow_query_log_file = /var/log/mysql-slow.log
#long_query_time = 2
innodb_strict_mode=OFF
sql_mode=ERROR_FOR_DIVISION_BY_ZERO,NO_AUTO_CREATE_USER,NO_ENGINE_SUBSTITUTION
bind-address = ::ffff:127.0.0.1
local-infile=0

Do i need to manually add the lines to the form:
query_cache_limit = 1M
query_cache_size = 1M

then restart the DB with:
systemctl restart mysqld
 
If the cause for the many locks is not the cache configuration, it can only be the website itself that is creating too many SQL requests in too short time. You'll need to analyze what the website is doing, why it is sending so many SQL selects. I do not offer individual support.
 
Hi peter, same sort of issue. do you know how i can rectify these errors i get when running a task oin a website, the task gets so far then spits out these errors and wont progress any further

AH01067: Failed to read FastCGI header, referer:...................
(104)Connection reset by peer: AH01075: Error dispatching request to : , referer:.................................

ive tried to Google this but not getting much help. Here are the specs of the domain if this helps:
1633112742300.png
 
There is two possibilities:
a) Your query cache is too small.
b) Your query cache is too large.
I'd guess that (b) is the likely cause. What happens here is that your query cache is very big, so that each request needs to go through the cache entries to seek a match. This takes a lot of time. While the one process is not finished, a second one is waiting, a third one, a fourth one ...

There are two problems with the query cache actually:
One, it is not really multi-threaded, which means different threads will fight for locks on the cache.
Two, it is not implemented very efficiently: It only caches reads and does not write-through on changes, just invalidating all affected portions.
This means, the query cache is not very useful except in situations where the application repeatedly does large, slow queries, like e.g. magento. Even then it will not help much because of the locks.
(I've found that it helps a lot to use varnish before magento. Most repetitive queries will be caught by varnish before they even reach magento, and for the rest, the query cache will help because those remaining threads are too few to significantly compete for the locks to the query cache.)
Do you know how i can "fix" this? im not technical in this department
 
Do you know how i can "fix" this? im not technical in this department
Just set query_cache_size to 0 and check if it performs better.
And your application should cache results locally instead of performing expensive queries again and again. Checking whether those queries make use of indexes would be a good idea too. (magento2 fails both)
 
Back
Top