• The Horde webmail has been deprecated. Its complete removal is scheduled for April 2025. For details and recommended actions, see the Feature and Deprecation Plan.

Issue Monitoring extension uses another language than the rest of Plesk

King555

Regular Pleskian
Server operating system version
Ubuntu 24.04.1 LTS
Plesk version and microupdate number
Plesk Obsidian 18.0.66 Update #1 Web Admin Edition
My Plesk is German and under "Languages" German is also the only enabled one and the default language.

But the monitoring extension is English (and it is since it was installed 1.5 weeks ago).

I'm pretty sure it was German on my last server/in my last Plesk installation.

How can I switch the language there?

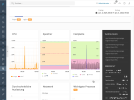
There is something which uses the English language pack, see the attached screenshot. Maybe that's the monitoring extension.
 

Attachments

  • languages.jpg
    languages.jpg
    11.5 KB · Views: 8
What monitoring do you use with Plesk? Is it 360 Monitoring or built-in Monitoring?

If it is 360 Monitoring, then... It is possible to log in to the 360 Monitoring website (Plesk 360) and to change the language, then the language will be automatically changed in Plesk; here is an example of how it will look like,
1735896175333.png


If it is built-in Monitoring, then... Plesk uses Grafana software to visualize metrics. In the past, Grafana supported only English. It seems that the Grafana language can be changed currently; unfortunately, this will not affect dashboards, graphs, and metrics names, as these locales are hardcoded in Plesk. Based on the information, I see three options:

1. If you are interested in changing the language for Grafana software, you could do so in the file grafana.ini (usually, the conf.file is located in /etc/grafana). See Configure Grafana | Grafana documentation for more details.

2. If you are interested in changing the names of dashboards and graphs, you can enable the "SuperAdmin" mode in Plesk for the Grafana extension,
To grant the Grafana administrator the write permission:
  1. Add the following lines to the panel.ini file:
    [ext-grafana]
    allowSuperAdmin = true
...and customize the graphs as you want.

3. If you are interested in having translating done automatically by changing the interface language in Plesk, I would recommend creating a new user request in the Plesk UserVoice, Feature Suggestions: Top (2070 ideas) – Your Ideas for Plesk
 
First of all thanks for the detailed explanation.

I use the built-in monitoring feature. On my previous server I definitely had the monitoring page(s) completely in German, so 2. and 3. are no solutions.

I changed the language in the ini file and also in my profile in the Grafana application, but this didn't change anything. I also restartet the Grafana service twice (one time per CLI and one time via Plesk GUI).
 
I use the built-in monitoring feature. On my previous server I definitely had the monitoring page(s) completely in German, so 2. and 3. are no solutions.
I can only guess the previous server was running Plesk Onyx (17.x), but even in this case, some hardcoded strings are not translated.
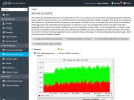
E.g.: Plesk Onyx with deprecated "Health Monitoring"
1736152448580.png

It could also be a third-party extension/service. If you have screenshots, they can help determine the details.
 
No, I used exactly the same version as I use currently, i.e. Plesk Obsidian 18.0.66 Update #1 Web Admin Edition. But I used Ubuntu 18 instead of 24, which I use now.

Concerning screenshots: Do you mean from the old server? Because that server does not exist anymore.

And concerning third-party extension: I can only say that I had it under a main menu item called "Monitoring" (exactly like currently) and that it looked exactly like currently (only in another language).

When you speak of hardcoded strings, do you mean the texts in the graphs itself or the whole surrounding, e.g. the menu and the settings page?

By the way, I also tried to reinstall the extension, which also did not change anything.
 
When you speak of hardcoded strings, do you mean the texts in the graphs itself or the whole surrounding, e.g. the menu and the settings page?
It is about strings like "memory", "Last 1 day", etc.

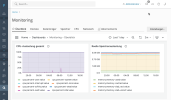
I have opened my server now and, surprisingly for me, found the interface like on the screenshot.
Is this what you want to configure? :)
1736178034246.png

I didn't do anything specific, but I will clarify details internally and come back then.
 
I found the solution! Although my user account was set to German/Germany, there was "en-US" in the table "smb_users", field "locale", in the datebase "psa". I just had to save my user again (I guess I could also have edited the database entry) and then it was set to "de-DE". Then I had to reinstall the monitoring extension (I also reinstalled Grafana, maybe that's not necessary) and now everything is German.

I guess the problem is kind of a bug. The initial installation, the only time I edited (created) my user account, had two languages, German and English. Afterwards I disabled English and had only German, but this did not affect the monitoring extension. When I viewed my user account, it was not only set to German, there was only German in the list. But internally it was set to English – maybe I would have seen it if English was still active. The languages list now shows that 2 elements (what is the second element?) use German and non uses English. Is the overall language in Plesk independent from the user account language? It seems like this.

The topic is solved, thanks!
 
Back
Top