• If you are still using CentOS 7.9, it's time to convert to Alma 8 with the free centos2alma tool by Plesk or Plesk Migrator. Please let us know your experiences or concerns in this thread:
    CentOS2Alma discussion

Question % of hardware and network resources used by mail services

Mike99

Basic Pleskian
How can I find out how much server CPU and network resources are consumed by mail services? Any suggestions, scripts or one line commands to filter and find out stuff from logs are welcome. Also if you see my approach as philosophically bad, I am listening.

  1. How much of the overall traffic is consumed by ports used by email services such as postfix/dovecot/...
    This is probably what is causing my lower TTFB, but I want to be sure.
  2. How much of the CPU is consumed by mail related services Roundcube PHP workers, postfix/dovecot/...

Few of my servers are getting slower loads by time, but I am not adding new hosting customers and all websites are kind of static, no e-commerce, no active users, only e-mail new e-mail accounts are added. I wanted to separate mail server from hosting servers, but it is not possible in Plesk - SSLit or LetsEncrypt extension is not able to verify acme challenge if main domain is on another server than the webmail subdomain.

Thank you.
 
# ps aux | grep postfix
# ps aux | grep dovecot
will give you all these processes with their RAM and CPU usage. The problem there could be that most of the processes are not consuming much resources, but one might. It is also possible that none of them is using lots of resources, but the whole bunch of them together might.
 
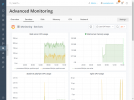
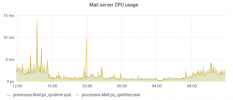
In Plesk Obsidian, the Advanced Monitoring extension shows the usages of services that are split into a few areas:

Mail service usage.png
 
In Plesk Obsidian, the Advanced Monitoring extension shows the usages of services that are split into a few areas:

View attachment 17697
Thank you, I have seen this graph, but I am not sure what it means, mine is in "ms" units, for me it is quite irrelevant information, unless I don't understand it or can not compare it to some other metric, ideally maximum, than % would be much more useful. Any idea if 3 - 15ms is good or bad?

Screenshot from 2020-10-15 11-53-29.png

My CPU:

# lshw -C CPU
*-cpu
description: CPU
product: Intel(R) Core(TM) i7-7700 CPU @ 3.60GHz
vendor: Intel Corp.
physical id: 18
bus info: cpu@0
version: Intel(R) Core(TM) i7-7700 CPU @ 3.60GHz
serial: To Be Filled By O.E.M.
slot: CPU1
size: 3689MHz
capacity: 4200MHz
width: 64 bits
clock: 100MHz
capabilities: x86-64 fpu fpu_exception wp vme de pse tsc msr pae mce cx8 apic sep mtrr pge mca cmov pat pse36 clflush dts acpi mmx fxsr sse sse2 ss ht tm pbe syscall nx pdpe1gb rdtscp constant_tsc art arch_perfmon pebs bts rep_good nopl xtopology nonstop_tsc cpuid aperfmperf pni pclmulqdq dtes64 monitor ds_cpl vmx smx est tm2 ssse3 sdbg fma cx16 xtpr pdcm pcid sse4_1 sse4_2 x2apic movbe popcnt tsc_deadline_timer aes xsave avx f16c rdrand lahf_lm abm 3dnowprefetch cpuid_fault epb invpcid_single pti ssbd ibrs ibpb stibp tpr_shadow vnmi flexpriority ept vpid fsgsbase tsc_adjust bmi1 hle avx2 smep bmi2 erms invpcid rtm mpx rdseed adx smap clflushopt intel_pt xsaveopt xsavec xgetbv1 xsaves dtherm ida arat pln pts hwp hwp_notify hwp_act_window hwp_epp md_clear flush_l1d cpufreq
configuration: cores=4 enabledcores=4 threads=8

Same confusion goes for networks stats in Advanced Monitoring. It has packet/second unit, but how does anybody use that information in real life?
 
I am not sure what it means, mine is in "ms" units, for me it is quite irrelevant information, unless I don't understand it or can not compare it to some other metric, ideally maximum, than % would be much more useful. Any idea if 3 - 15ms is good or bad?
Yes, it is a known issue and it is in our backlog because much better to see percentages of usage instead of how many microseconds CPU works on mail tasks. Do you have any other services on the server (or servers with the same hardware and Plesk)? Do other services consume more CPU time than mail? What about graphs on the first tab, does it show that CPU is utilized at 100%?

----

I am not sure because have not validated the statements yet but maybe it could help you: How we can see the CPU usage of processes as percentage? · Issue #2862 · collectd/collectd

What we have:
  • 2 cores;
  • Usage less than 5ms (=5000 microseconds) with some spikes.
Result:
  • (5000 / 1000000) * 100 = 0.5%
  • 0.5% for 2 cores or 0.25% for a server.
 
Back
Top