• If you are still using CentOS 7.9, it's time to convert to Alma 8 with the free centos2alma tool by Plesk or Plesk Migrator. Please let us know your experiences or concerns in this thread:
    CentOS2Alma discussion

Issue Ram consumption very high

dicker

Basic Pleskian
Server operating system version
Ubuntu 20.04.5 LTS
Plesk version and microupdate number
Plesk Obsidian Version 18.0.46 Update #2
Hello,
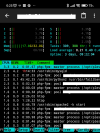
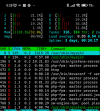
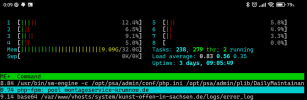
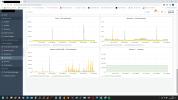
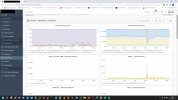
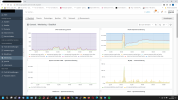
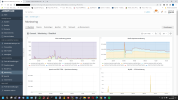
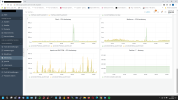
on my Plesk server, around 0:05, the RAM consumption shoots up immeasurably. After about 30 minutes it's ok again.

What is Plesk doing at this time and how can I fix it? It was so bad that no websites could be accessed.

I had set the cron jobs, which were set to 0:00 in the Plesk administration, to a different time because it was the day before yesterday.

Backup is made at 3:00 am
 

Attachments

  • 1.png
    1.png
    340.2 KB · Views: 15
  • 2.png
    2.png
    405.4 KB · Views: 16
  • 3.png
    3.png
    121.2 KB · Views: 15
  • Screenshot (202).png
    Screenshot (202).png
    226.3 KB · Views: 18
  • Screenshot (203).png
    Screenshot (203).png
    253 KB · Views: 19
  • Screenshot (206).png
    Screenshot (206).png
    234.5 KB · Views: 17
  • Screenshot (207).png
    Screenshot (207).png
    243.3 KB · Views: 21
I have looked at your screenshots, but I did not see the "immeasurably". The highest I see is a RAM load of 60%, but that would not be an issue. Just for me to understand you better, could you please point me to the screenshot or event where the issue is visible?
 
I'll post new pics tomorrow if the problem occurs again.

It's unusual that the problem is at the same time.
17 GB of RAM in use is also not normal.

So I asked what Plesk is running at this time that could cause the load. Somehow the sudden strong Antieg must be explainable.
 
RAM usage on Linux can and should normally be close to 100%. Maybe this helps:

You may still experience some issues, but I recommend to watch cpu load closely. An increase in RAM usage is not a problem unless the system is swapping.
 
Every time the RAM usage is more than approx. 10 GB, no websites and no Plesk work anymore.
I ask, what does Plesk do every night between 0:00 and 0:30 a.m. other than what can be seen in Plesk under Cronjobs?
Something must suddenly fill up the RAM.
 
There is nothing specific in Plesk that is happening. Plesk does have a nightly maintenance window, but this normally does not exactly start at midnight. It also does not put a lot of load or RAM usage on a system.

Have you checked the cpu load at the time when the problem occurs? Have you looked into the process list which processes consume a lot of cpu power at that time?
 
CPU usage was low.
I couldn't call up anything in Plesk anymore.
Everything had hung in the putty too.
I have now updated to the latest Plesk and disabled apcu and memcached for all PHP applications.
I only installed apcu and memcached a few days ago.

Let's see if tonight is better.
 
Are you using any type of external connection to the server like NAS, a Samba-connected "drive", an ERP system that tries to login to sync data, a mail system that syncs data once a night or something similar? I am asking because when the cpu load does not go up and RAM is only used 60% of what is available, the symptoms you describe match a Fail2Ban ban rather than a real server issue. Did you test whether you can still access your server from an independent IP address when the issue occurs? An IP address that is not associated with your local network or any device that regularly connects to your server?

If it is a virtual server (a "Container" like Virtuozzo or similar), also check this with your data center. Maybe you have been promised 32 GB of RAM, but their physical RAM runs out at the given time so that yours runs out way before it actually should.
 
I don't use that. This is a VServer based on Virtuoozo from a large German company.
I could turn off fail2ban for one night.
 
You can leave Fail2Ban on, but instead check the log at /var/log/fail2ban.log. Does it show a ban at the given time?
 
The only interesting line I think is the rollover. So obviously log rotation is happening at midnight on your system. This could go along with service restarts.
The other entries: There are quite a few SSH bans, you you need to check this against your own public IP address (of your home internet connection) at that time. Is it your IP address? Then it is likely that you are simply banning yourself for some reason like frequent false logins.
 
How can I determine when rollover should be?
My own IP is not included.
I'm logged in with Putty all the time.
The VServer then almost stops. No more domains can be accessed. CPU and load is down.
I was able to restart Apache. Then it was a little better but still took a long time to load the web pages.
 
Can you check whether there is suspiciously high iowait, e.g. by letting `iostat 10 -t` run in a terminal with enough scrollback buffer and checking for the interesting timestamps?
 
`iostat 10 -t` does not work

After disabling memcached and apcu on every PHP version things got a lot better.
The settings of mpm_event also play a role.
<IfModule mpm_event_module>
StartServers 2
MinSpareThreads 25
MaxSpareThreads 75
Thread limit 64
ThreadsPerChild 25
MaxRequestWorkers 150
MaxConnectionsPerChild 10000
</IfModule>

were better than
<IfModule mpm_event_module>
StartServers 4
MinSpareThreads 25
MaxSpareThreads 75
Thread limit 64
ThreadsPerChild 25
MaxRequestWorkers 800
Server limit 32
MaxConnectionsPerChild 10000
</IfModule>
In the photo you can see the process that causes the RAM to shoot up. If RAM usage is high, it was not possible to open a website or login to Putty. But about only 2 minutes. Then it worked again. Around 0:28 the process was finished and the RAM was immediately back to normal.
 

Attachments

  • Screenshot (248).png
    Screenshot (248).png
    236.3 KB · Views: 7
  • Screenshot (249).png
    Screenshot (249).png
    243.7 KB · Views: 7
According to your screenshots, the Maintenance is only using 35% of CPU capacity and RAM is only used up to 60%. If this situation brings your server down, it is advised to try the same installation at a different hosting provider.

As a rule of thumb, collisions of processes can considerably slow down a system when they reach approx. 67% or more of cpu load. Image this as a logarithmic function. When the load is less than 2/3 of full load, the payload processes and the time slicing between processes are no problem for the system. However, when the payload increases to above 67%, the administrative work of the operating system to manage the processes dramatically increases, and the payload processes are also competing much more intense against one another so that from that point it only takes a bit more load to tip the system over. A higher load for example slows down PHP script execution, this again causes scripts to occupy process slots a lot longer than what they'd normally take, this again creates more and more processes at the same time that are competing for cpu time slices etc.

But with the load you are showing in the screenshots, there should not be any issues at all. A 35% is like "nothing". RAM usage of 95% would not be critical, but yours is only around 60. So there you go, this setup on a different system will probably not cause much trouble.
 
I really didn't want to switch providers. The provider only has Virtuozzo. So far it's always been going really well. I can go from 8 to 10 core and more RAM at most. Then a connection of up to 1 GBit would also be possible. Now up to 512 Mbits.
But according to your message, that doesn't do anything either.
I've attached another screenshot. There is definitely a peak load at the affected time. Apparently the RAM is fully utilized briefly and then nothing works for a few minutes. The task that causes the problems cannot be postponed? It always goes very well. Only this one task causes the problems. Is that just because of the Virtuozzo?
 

Attachments

  • Screenshot (253).png
    Screenshot (253).png
    242.7 KB · Views: 2
You can check the times of daily maintenance as described here:
You could also try to modify these, but what good could it do? It will only move the issue to a different time, but it will still exist.

The problem seems to be that the promised service is not being fulfilled. If a system is not using all cpu it won't halt. If yours is briefly using all RAM it might swap, but it will not stall. 32 GB is enough for Plesk. The minimum system requirement is only 1 GB RAM and 1 GB swap. Although more is recommended, with 32 GB that are not even fully used you can be sure it is enough RAM.

But can you be sure that the physical machine that hosts your container has enough RAM? You might see 32 GB, but if the machine has for example 256 GB and it has 20 customers with Plesk who all run their maintenance at midnight and ask for 17 GB, your own RAM will be exhausted although your own contract should guarantee you 32 GB. I think with all the screenshots you are showing it is likely a provider issue, not so much a software issue that is causing the problem. Even if you move your own maintenance out of the way, others on the same hardware might still use so much RAM and cpu power at the given time that your server will stall. It might really not be your own setup that is causing it.

What you could try is to run each nightly maintenance task separately to find out whether there is one specific task that brings the system down. This could help you narrow the issue.
 
As a rule of thumb, collisions of processes can considerably slow down a system when they reach approx. 67% or more of cpu load. Image this as a logarithmic function. When the load is less than 2/3 of full load, the payload processes and the time slicing between processes are no problem for the system. However, when the payload increases to above 67%, the administrative work of the operating system to manage the processes dramatically increases, and the payload processes are also competing much more intense against one another so that from that point it only takes a bit more load to tip the system over.
No, the CPU load is not a good measure for this. You have to take into account the niceness of the process.
For example, it doesn't hurt at all if the system uses all available CPU power for compression threads.
A better measure is the load average: It tells the average of how many processes are waiting at any given time. In order to avoid processes piling up, this number should be under 1 - per vcore, that is. So on a system with two 12-core CPUs with HT, the loadavg should not exceed 48.

This can be different for systems that are not adequately cooled and can't continuously run with full load for extended amounts of time. But you'd rather find such thermal designs in mobile devices. Servers should always be able to run under full load; if they can't, check the fans.

But there is another underlying issue: Why is the plesk task using so much RAM, and where does all the data filling the RAM come from and go to?
That's why I asked for iowait. If it is high, you have an I/O bottleneck, which can stall the system if everything is waiting on data. This can be caused by failing mass storage, but also by overbooking the vserver host.
 
Back
Top