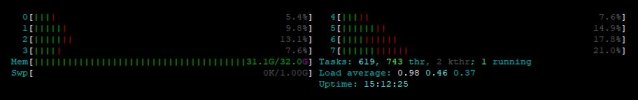
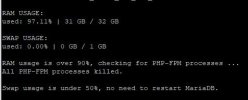
Are you aware that RAM is not your issue (see your own post above where you sum it up to only 22 GB out of 32 GB), but too many long-running requests against websites on your server? Regarding the constant high RAM usage, please first check this to understand what Linux does with RAM:
Help! Linux ate my RAM!
Next step would be to check which domains consume the most cpu power. You can determine this by
# ps aux | grep php-fpm
or see a sorted output "live" of the 20 most frequented processes:
# watch "ps aux | sort -nrk 3,3 | head -n 20"
Then go into /var/www/vhosts/<subscription>/logs[/<add-on-domain>]/access_ssl_log of that domain and check what is happening in your website. For example check from which ip addresses the most traffic comes in:
# awk '{ print $1}' access_ssl_log | sort | uniq -c | sort -nr | head -n 10
Are these valid sources or are they bad bots? Maybe blocking the sources can solve your server issues?
Regarding cgroups: Are you using the cgroups extension that comes with the Plesk Web Pro and Plesk Web Host editions for free? If so, maybe limiting the resource usage of the problematic websites can help. If not and if you believe the issue is in the database server, you could limit the resource usage of your database service "mariadb" by creating rules on the operating system level, e.g.
Code:
# systemctl set-property mariadb MemoryAccounting=true
# systemctl set-property mariadb MemoryMax=12G
# systemctl set-property mariadb CPUAccounting=true
# systemctl set-property mariadb CPUQuota=50%
# systemctl daemon-reload
# systemctl restart mariadb
But please make sure that you understand what these commands are doing before you apply anyof them, because especially percentages are always relative to all other percenttage settings affecting the same service. Maybe this can help:
RHEL7: How to get started with CGroups. - CertDepot