pleskuser67553
Basic Pleskian
- Server operating system version
- CentOS Linux 7.9 and AlmaLinux 8.9
- Plesk version and microupdate number
- Plesk Obsidian Version 18.0.59 Update #2
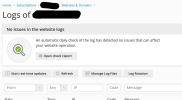
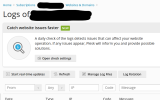
Is there a way in Panel.ini or settings to permanently hide or collapse the UI panel that appears at the top of the website logs? I find I'm collapsing it manually 99% of times that I go to look at website logs in Plesk. It does not stay collapsed the next time I go into website logs (i.e. apparently not storing a preference in cookies). It takes up way too much space on the screen.
When I do collapse it using the chevron button, it's necessary to click the UI 'Refresh' button, or temporarily resize the browser viewport with dev tools, to force the log area to fill the remaining part of the screen. The log area should, at the very least, resize when the chevron button is clicked please.
I know I can hide it in my browser with chrome/userContent.css (which might be my last resort).
And I know I can disable the feature altogether in Panel.ini with this:
But I don't want that yet - I'm still evaluating whether it's a useful feature (mostly producing false positives for my use cases - needs some granular options for ignore this and that, and more history in the charts).
Example: log checking enabled via its UI in Tools & Settings > Assistance and Troubleshooting > Website Log Check

Example: log checking disabled via its UI

When I do collapse it using the chevron button, it's necessary to click the UI 'Refresh' button, or temporarily resize the browser viewport with dev tools, to force the log area to fill the remaining part of the screen. The log area should, at the very least, resize when the chevron button is clicked please.
I know I can hide it in my browser with chrome/userContent.css (which might be my last resort).
And I know I can disable the feature altogether in Panel.ini with this:
INI:
[websitesDiagnostic]
enabled = false
But I don't want that yet - I'm still evaluating whether it's a useful feature (mostly producing false positives for my use cases - needs some granular options for ignore this and that, and more history in the charts).
Example: log checking enabled via its UI in Tools & Settings > Assistance and Troubleshooting > Website Log Check

Example: log checking disabled via its UI

