• If you are still using CentOS 7.9, it's time to convert to Alma 8 with the free centos2alma tool by Plesk or Plesk Migrator. Please let us know your experiences or concerns in this thread:
    CentOS2Alma discussion

Resolved CPU loads at 100% / Mail Log Browser Extension

othmaqsa

Regular Pleskian
Username:

TITLE

CPU loads at 100% / Mail Log Browser Extension

PRODUCT, VERSION, OPERATING SYSTEM, ARCHITECTURE

20.04.4 LTS
18.0.45 Update #2

PROBLEM DESCRIPTION

Hello,

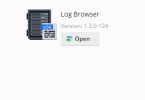
CPU gets up to 100% when the extension (Mail Log Browser) is loading the data.

I tried to reproduce this 3 times, and I confirm in my side, that I notice unusual CPU SPIKE.

STEPS TO REPRODUCE

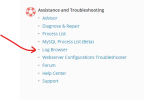
Just try to access to the Log Browser, and normally the data will not loading.

After, try to check the CPU.

ACTUAL RESULT

CPU gets up to 100%

EXPECTED RESULT

CPU should not be load at 100% to get the log.

ANY ADDITIONAL INFORMATION

(DID NOT ANSWER QUESTION)

YOUR EXPECTATIONS FROM PLESK SERVICE TEAM

Help with sorting out
 
@othmaqsa can please append the bug report with resource details of your server and the file size of your mail log. You can view the size of the mail log by running the ls -lh /var/log/mail.log command via SSH. Those details help the developers to better diagnose the issue you're facing.

Also, your referring to the "Mail Log Browser" extension. However there is no extension with this name. There are two similar extensions that allow users to view mail logs. Those are "Log Browser" and the "Mail Log" extension. Just to avoid any confusion, which one are you having trouble with?
Hello @Kaspar ,

Thank you for your quick message.

I just checked, it's the Log Browser extension that is causing the problem.

Another user also confirmed it to me this morning, he confirmed to me that his CPU went up to 70%, on my side it went up to exactly 97%.

This spike happened after an attempt to access Log Browser.

For the log and resources details related to my server , can I send it to you later please? I'm away right now and I can't connect to the server by ssh.

Thank you.
 

Attachments

  • Screenshot 2022-07-31 192104.png
    Screenshot 2022-07-31 192104.png
    23.3 KB · Views: 18
  • Screenshot 2022-07-31 192131.png
    Screenshot 2022-07-31 192131.png
    5.9 KB · Views: 17
  • Screenshot 2022-07-31 192207.png
    Screenshot 2022-07-31 192207.png
    104.1 KB · Views: 16
Since the "Mail Log Browser" extension start providing ability to see systemd/journalctl logs, the extension was renamed to "Log Browser" with the previous release. Don't worry about developers, all development participants are aware of the renaming. And we are monitoring feedback after release to figure out how success it was.

I will come back a little bit later with new information about the issue/bug.
 
Could you please show the output of the command `journalctl --disk-usage`?
And just in case: How many CPUs on the server? What disks are used on your server? Is there any information what process (and/or in what state) utilize the CPU?
 
Hello @AYamshanov ,

Sorry for the delay.

The output of the command is: Archived and active journals take up 3.9G in the file system.

For the server : 2vCores , 4GB RAM, 120GB SSD.

I see that a new update of Log Browser has been pushed yesterday. Does this update solve this issue ?

Thank you!
 
Hello, i would like to add some data to the research of the devs.
I am maintaining a Plesk system for my friend, and he was asking me about some mails missing etc, to hunt for, in the logs and first i was happy to see such extension got its way into plesk, but on the first run i saw that seems to load forever, but then i saw it loaded tough. So i flipped up chrome inspector to see where the time fly away. Here the tech details about the server:

Ubuntu 20.04.4 LTS
Plesk 18.0.45 Update #2

Server (VZ container ): 6vCores, 16GB RAM, 591GB storage


/var/log/maillog - 396 lines:
From Aug 5 02:05:45 - To Aug 5 02:37:42

/var/log/maillog.processed - 62038 lines:
From Aug 4 02:02:38 - To Aug 5 02:05:33

journalctl --disk-usage
Archived and active journals take up 4.0G in the file system.

A reload of the logs for 5th Aug took according to Chrome: 7.9 min on waiting for response

The command in the background seems to limit its requests to journald to 1024 lines, and repeats itself as long it read the requested timeframe, 1day per default, but god beware us from the consequences, if that filter gets cleared:

Code:
journalctl --no-pager --quiet --output=json --reverse --show-cursor --lines=1024 --after-cursor="s=HEX;i=HEX;b=HEX;m=HEX;t=HEX;x=HEX" SYSLOG_FACILITY=2

Why it is not configurable to some other defaults (to allow quicker loadtimes) like the last 4hours, or the last hour. But still it needs optimizations, because grepping and zgrepping through about 8 maillog files is still lot quicker, but for most plesk-using admins, it is not the daily routine, to use ssh, and grep for some logs.
 
Hello @AYamshanov

Do you have any news regarding this issue I encountered?

I hesitate to access the extension otherwise there is a risk that I will end up with a CPU at a high load again.

Thank you.
 
Hi,

Right now developers works on tasks started before we found the issue.

The bug fix process for that issue will be started as soon as any developer get free from the current tasks. Right now there is no exact ETA but it should be done in this month.
 
Hi,

Right now developers works on tasks started before we found the issue.

The bug fix process for that issue will be started as soon as any developer get free from the current tasks. Right now there is no exact ETA but it should be done in this month.

Can we manually install Log Browser v1.2.1 in the meantime?
 
Unfortunately, there is no supported ways to install v1.2.1 because in Plesk Extension catalog the previous extension version is replaced by the new one during a publication process.

The bug fix process for that issue will be started as soon as any developer get free from the current tasks.
The issue has been taken to work by a developer. I will keep you posted about the process.
 
Hi othmaqsa,

The version 1.3.2 contains another fix. Some of customers could't access Log Browser in Plesk <=18.0.45 due to a new option added in Plesk 18.0.46.
The extension again works in Plesk versions 18.0.45 and earlier. In Plesk 18.0.46 and later, it is possible to access the extension if access to the “Assistance and Troubleshooting” section is enabled in Tools & Settings > Restricted Mode Settings (under “Plesk”). (EXTPLESK-3834)

The task for optimizing work with journalctl (the "100% CPU load" issue) is now being in progress with high priority. Should be done soon but there is no ETA yet.
 
Hi,

If everything goes well, tomorrow (Friday) we will publish the new version of the extension with the first part of performance improvements we already have made to make these changes available for everyone.

After that, we continue working on the second part of improvements (and new features as well) we have in our backlog.
 
I was too optimistic, testing took additional time. The new version has been published. It means the update should be available in Plesks soon.

1.3.3 (30 August 2022)​

  • Significantly improved the extension's performance.
 
Just a few additional words to the release notes. As I said before, there is only a part of planned improvements. We improved time of the first load of the extension and also improved backend for extension's filter (e.g. the first load time should decreased from tens of seconds to just 2-3 secs; filters now are applied on the backend, it reduces searching time and amount of data transferred to the frontend).

But if you try to get all available logs from the system journals without any configured filters, it keeps work slow because systems logs contain lots of GBs, extracting of these data takes lots of CPU, disk, network resources.

Meanwhile, we don't stop there and we keep working on performance in the second development part.
 
Hi, unfortunately there is no improvement at least for me. :(
It's still running with high CPU without coming to an end.
I have a Vserver Ubuntu 20.04 LTS 64bit + Plesk Obsidian, 4 cores + 4gb Ram
Archived and active journals take up 1.3G in the file system
 
Back
Top